Has the S&P 500 Ever Lost Money Over 20 Years? Every Rolling Period Since 1926, Even the One That Started Just Before the Great Crash


Picture New Year's Day, 1929.
You have just put $10,000 of your savings into 90 of the biggest companies in America. Everyone you know is getting rich in stocks. Ten months later, the Great Crash begins. By the end of 1932, your $10,000 is worth $3,523.
That is the nightmare every burned investor carries around. So here is the question that matters: has the S&P 500 ever lost money over 20 years?
No. I checked every rolling 20-year period since 1926, all 81 of them, with dividends reinvested. Not one ended with less money than it started with. Not even the one that began in January 1929. That unlucky investor still finished 1948 with $15,975, and slightly more buying power than they started with, even after inflation.
The Short Answer (Save This) ✔ All 81 rolling 20-year periods from 1926 to 2025 made money, with dividends reinvested. ✔ All 81 also beat inflation. The worst one, 1929 to 1948, still grew 0.63% a year after inflation. ✔ The worst 20 years turned $10,000 into $15,975. The typical 20 years turned it into $79,238. The best turned it into $260,172. ✘ Shorter periods are a different story: 26 of the last 100 calendar years lost money, and 5 of the 91 rolling 10-year periods did too. ✘ History is not a promise. Japan's stock market took 34 years to climb back to its 1989 peak. |
What's inside this guide:
The worst, typical and best 20-year periods since 1926, in dollars
What happened to the investor who bought just before the 1929 crash
Whether the answer changes after inflation
How your odds of losing money shrink the longer you hold, and the simple engine behind it
Every 20-year period since 1926 in one table
Four honest catches, and a simple plan to use all this with your own money
The Short Answer: Not Once in 81 Tries
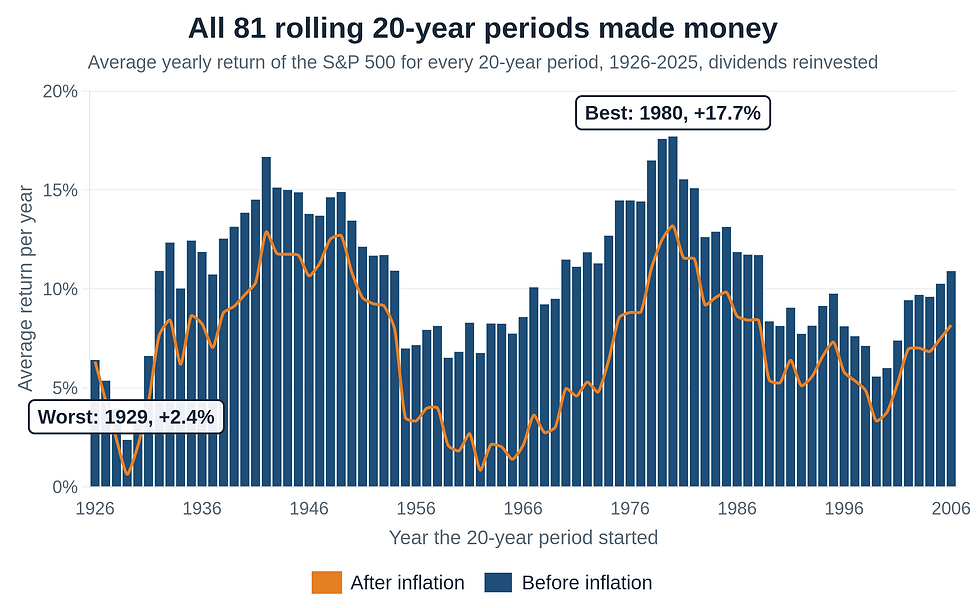
A "rolling 20-year period" simply means every 20-year window you could have picked, starting in a different year each time. The first runs from 1926 to 1945. The next from 1927 to 1946. The last from 2006 to 2025.
That gives 81 different investors, each starting in a different January and holding for exactly 20 years. Some started in booms. Some started on the edge of disasters. Every one of them ended with more money than they put in.
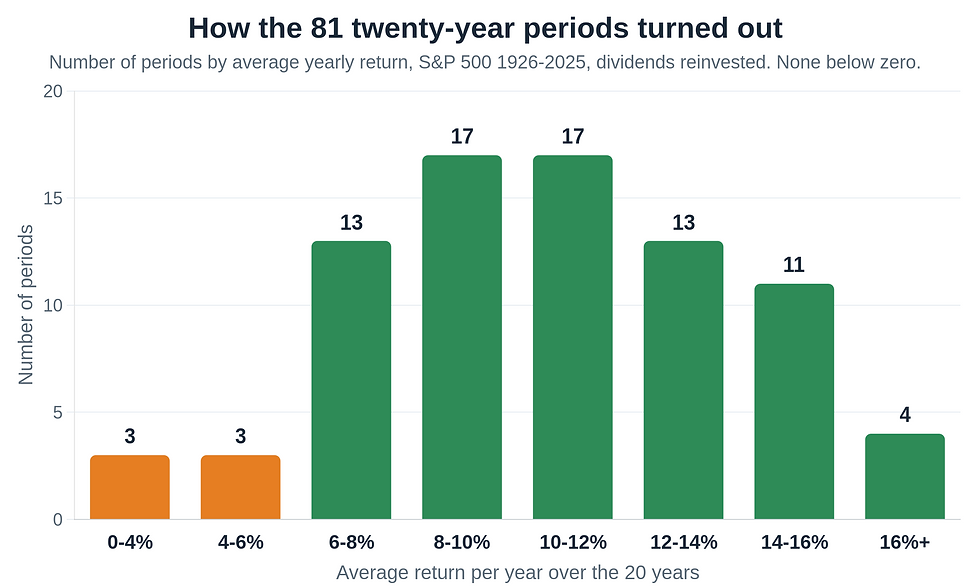
Here is how the 81 periods shook out for $10,000 invested in the S&P 500 with dividends reinvested:
Outcome | Per year | $10,000 became |
|---|---|---|
Worst (1929 to 1948) | 2.37% | $15,975 |
Typical (the median) | 10.90% | $79,238 |
Most recent (2006 to 2025) | 10.90% | $79,238 |
Best (1980 to 1999) | 17.70% | $260,172 |
Look at the second and third rows. The most recent 20 years landed exactly on the median. Those 20 years included the 2008 financial crisis, the 2020 pandemic crash and the 2022 bear market. The "typical" result still happened.
A few more numbers worth sitting with:
80 of the 81 periods at least doubled the money. The only one that didn't was 1929 to 1948.
76 of the 81 at least tripled it.
54 of the 81, two out of every three, turned $10,000 into $50,000 or more.
27 of the 81, one in three, turned $10,000 into $100,000 or more.
That is the quiet power of a long holding period. The scary years don't disappear. They just get outnumbered.
How I Checked (So You Can Trust the Numbers)
Most articles on this topic quote one number from one source and move on. You deserve to see the method.
I used annual total returns for the S&P 500 with dividends reinvested. For 1928 to 2025, the figures come from Professor Aswath Damodaran's historical returns data at NYU Stern, updated in January 2026. For 1926 and 1927, I used the long-running Ibbotson SBBI large-company stock series, the standard starting point for US market history.
For inflation, I used the US Bureau of Labor Statistics Consumer Price Index, measured from December to December, so each year's inflation lines up with each year's stock return.
Three Things to Know About This Data 1. Before March 1957, the index held about 90 large companies, not 500. It was the S&P 500's predecessor and is the standard series used for this period. 2. These are calendar-year windows (January to December). If you bought at the exact monthly peak, your numbers would be a little worse. I'll show you what monthly studies found later. 3. The data has no fund fees or taxes. A low-cost index fund today costs a small fraction of 1% a year, so the gap is small, but it isn't zero. |
Why rolling periods instead of the famous "10% a year average"? Because averages hide the order in which returns arrive. No real person earns the average. They earn whatever their own start date and end date give them. Rolling periods show you every start date at once, including the unlucky ones.
The Worst 20 Years in History: The Investor Who Bought Before the Crash
Let's go back to our investor from New Year's Day, 1929.
On September 3, 1929, the Dow Jones Industrial Average closed at a record 381.17. By July 8, 1932, it had fallen to 41.22, a loss of 89%, according to the Federal Reserve's history of the crash. The Great Depression had begun.
Here is what happened to $10,000 invested in the broad index at the start of 1929, year by year:
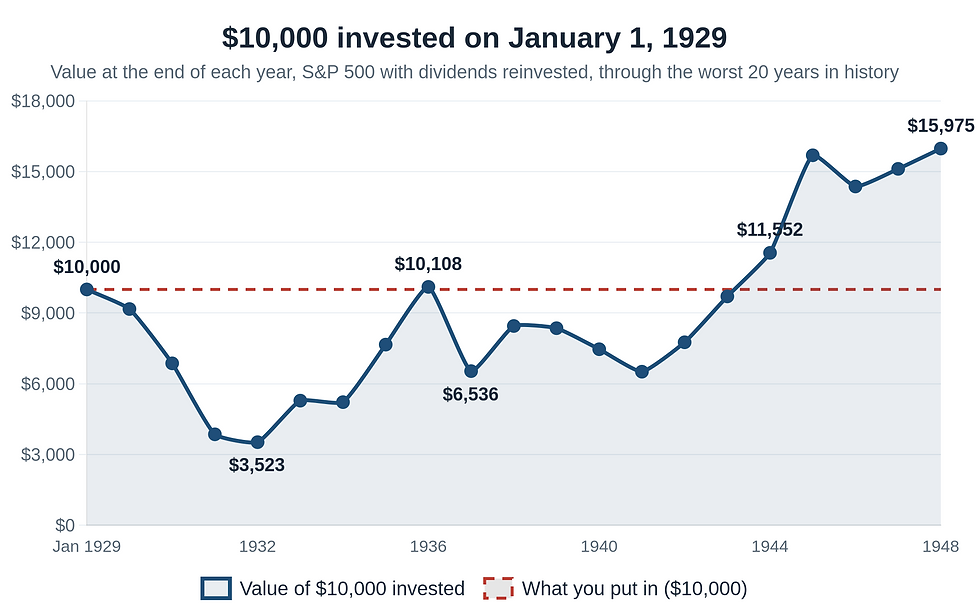
End of 1929: $9,170. Uneasy, but not a disaster yet.
End of 1932: $3,523. Down 65% after four straight losing years.
End of 1936: $10,108. Back above even, thanks to a huge rebound and dividends.
End of 1937: $6,536. Smashed again, down 35% in a single year.
End of 1944: $11,552. Back above even for good, in the middle of World War II.
End of 1948: $15,975. Twenty years later, a 60% gain.
That works out to 2.37% a year. Nobody would call that a great result. But it was a gain, through the Great Depression, a second crash in 1937 and a world war.
The "25 Years to Recover" Myth
You have probably heard that it took the stock market 25 years to recover from 1929. That's true for the Dow's price. It didn't close above 381.17 again until November 23, 1954.
But price is only part of what an investor earned. In April 2009, the financial journalist Mark Hulbert showed that once you count dividends and the falling prices of the 1930s, an investor who bought the average stock at the 1929 top was back to even by late 1936. That's when our calendar-year investor got back to even too.
Why Dividends Matter So Much When the market hit bottom in July 1932, the dividend yield on stocks was close to 14%, according to Robert Shiller's data as cited by Hulbert. Investors who kept collecting and reinvesting those dividends were buying cheap shares the whole way down. Anyone who looks only at the price chart misses half the story. Always compare total returns, never price alone. |
There is a darker lesson hiding in that year-by-year list, too. The investor who sold at the end of 1932 locked in a 65% loss forever. The one who did nothing ended up ahead. The data didn't save people. Staying put did.
If you're carrying a big loss right now, the math of climbing back is worth understanding. I walk through it step by step in How Long Does It Take to Recover From a 50% Stock Market Loss?
Does the Answer Change After Inflation?
This is the question smart investors ask next, and it's the one most articles skip.
Making money isn't enough. Your money has to buy more at the end than it did at the start. Otherwise you've just watched the numbers on your statement get bigger while your groceries got more expensive.
So I adjusted all 81 periods for inflation. The answer still holds: not one 20-year period lost buying power.
But some came close. These were the three tightest calls:
Period | After inflation, per year | $10,000 of buying power became |
|---|---|---|
1929 to 1948 | 0.63% | $11,349 |
1962 to 1981 | 0.84% | $11,819 |
1960 to 1979 | 1.82% | $14,352 |
The 1962 to 1981 period deserves a closer look, because it feels more like today than 1929 does. There was no Great Depression in it. Instead, inflation crept up through the late 1960s and exploded in the 1970s, hitting 13.3% in 1979.
Stocks still made money in that stretch, 6.76% a year before inflation. But rising prices ate almost all of it. From 1966 to 1981, stocks actually lost about 1% a year after inflation. Twenty years was just long enough to squeak out ahead.
On the other side, the typical 20-year period grew 6.96% a year after inflation. That is enough to roughly quadruple your buying power. 65 of the 81 periods at least doubled it.
What Monthly Studies Found In 2020, Duncan Lamont, head of strategic research at Schroders, looked at US stocks month by month from 1871, after inflation. Out of 1,551 rolling 20-year periods, only one lost money: July 1901 to June 1921, a stretch that included World War I and a burst of inflation. That one is older than our 1926 starting line. So the honest phrase isn't "never." It's "almost never, and not once in the last 100 years." |
How Your Odds of Losing Money Shrink the Longer You Hold
This is the chart I wish every new investor saw before buying their first share.
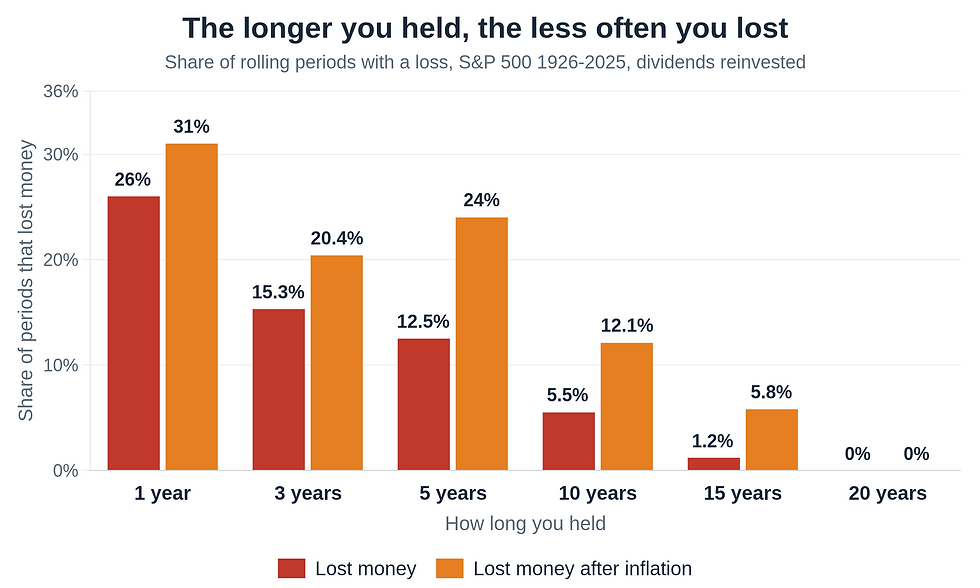
Here's what the data shows for the S&P 500 from 1926 to 2025, with dividends reinvested:
Holding period | Periods that lost money | Lost after inflation | Worst result per year |
|---|---|---|---|
1 year | 26 of 100 (26%) | 31% | -43.84% (1931) |
3 years | 15 of 98 (15.3%) | 20.4% | -27.30% (1930 to 1932) |
5 years | 12 of 96 (12.5%) | 24% | -12.71% (1928 to 1932) |
10 years | 5 of 91 (5.5%) | 12.1% | -1.67% (1929 to 1938) |
15 years | 1 of 86 (1.2%) | 5.8% | -0.20% (1929 to 1943) |
20 years | 0 of 81 (0%) | 0% | +2.37% (1929 to 1948) |
Read that table from top to bottom and you can watch risk melt away.
In any single year, the S&P 500 lost money about one year in four. Over five years, about one time in eight. Over ten years, about one time in 18. And 20 years is the first holding period in the whole data set where the worst case was still a gain.

Yes, a Whole Decade Can Lose Money
Notice the 10-year row. Five decades lost money, and two of them are recent.
An investor who started in January 2000 had less money at the end of 2009 than they started with: down about 9% after a full decade, even with dividends. The first three years alone, 2000 to 2002, cut the money by 37%. Then came 2008.
People called it "the lost decade," and many gave up on stocks for good.
The ones who kept going saw something different. That same January 2000 investor, holding for 20 years through 2019, turned $10,000 into $32,065. Two of the worst crashes in modern history, and the money still more than tripled.
That's why I tell burned investors to stop judging the stock market by the last few years. Ten years can still disappoint you. Twenty years, so far, hasn't.
Picture It Like This One year in the stock market is like the weather. Anything can happen, and some days are brutal. Twenty years is like the climate. Over a long enough stretch, the storms average out and the season you were promised shows up. The mistake is planning a 20-year goal around tomorrow's forecast. |
Why Time Works: The Engine Under the Hood
It's fair to ask why this pattern holds. Is it luck? A quirk of American history? Partly, and we'll get to that. But there's also a simple engine underneath.
When you own the S&P 500, you own a slice of about 500 large companies. Over long periods, your return comes from three sources:
Dividends. The cash companies pay out to their owners. Reinvested, they buy more shares, even during crashes.
Earnings growth. As businesses sell more and earn more over the decades, each share becomes worth more.
Changes in mood. What investors are willing to pay for each dollar of earnings. This swings wildly from year to year, and it causes most crashes.
Here's the key. Over one year, mood can swamp everything else. Fear can knock 40% off prices in months, even while the businesses underneath keep selling, earning and paying dividends.
Over 20 years, mood tends to drift back toward normal, while dividends and earnings keep piling up, year after year. The longer you hold, the more your result depends on the steady engine and the less it depends on the mood swings.
The Index Quietly Replaces Its Losers
There's a second reason, and most investors never think about it. The S&P 500 is not a fixed list. A committee at S&P Dow Jones Indices regularly removes companies that shrink or fail and adds rising ones.
So the index you owned in 1980 isn't the index you own today. Many of the giants of that era have shrunk, merged or disappeared. Their places were taken by businesses that barely existed back then.
A single stock can go to zero and never come back. An index that keeps swapping fading companies for growing ones is far harder to keep down. That's one reason I'd rather own the whole index than bet on finding the next winner, a case I make with two decades of evidence in Stock Picking vs. the S&P 500: What 20 Years of Results Say.
The Pattern to Remember Short-term returns are driven by fear and greed. Long-term returns are driven by dividends and earnings. Time doesn't make the stock market safe. It shifts the odds from the first engine to the second. |
The Day a Famous Magazine Declared Stocks Dead
On August 13, 1979, BusinessWeek ran a cover story titled "The Death of Equities: How Inflation Is Destroying the Stock Market."
It's easy to see why. Inflation was running above 10%. After inflation, stocks had lost ground for more than a decade: from 1966 to 1978 they fell about 1.7% a year in real terms. The S&P 500 sat at about 107.
Now look at what came next. The 20 years from 1980 to 1999 were the best 20 years in the entire data set: 17.70% a year. $10,000 invested at the start of 1980 became $260,172 by the end of 1999.
The worst-feeling moment in a generation was the launch pad for the best 20 years in a century. That pattern shows up again and again. In early 2009, after the S&P 500 had lost 36.55% in 2008, it felt like the end of the world. The 20 years starting in 2009 aren't finished yet. But from 2009 to 2025, the index returned 14.67% a year with dividends, turning $10,000 into about $102,400.
You can't know in advance which start date you're standing on. But you can choose to hold long enough that it matters far less.
Four Honest Catches Before You Bet Your Retirement on This
I'd be doing you a disservice if I stopped at "never lost money." There are four catches, and every one of them has cost real people real money.
Catch No. 1: The Index Didn't Lose Money. Many Investors Did.
The S&P 500 never lost money over 20 years. Plenty of people who owned it did.
How? They bought after a big run-up and sold in a panic during the next crash. They switched to "something safer" at the bottom and switched back after prices recovered. Each move felt sensible in the moment. Together, they turned a winning investment into a losing experience.
Our 1929 investor shows it perfectly. The person who sold in 1932 lost 65%. The person who held made a 60% gain. Same index. Same years. The only difference was behaviour.
If you've done this before, you're not stupid. You're human. I explain the eight mental traps behind it in Why Smart People Lose Money in the Stock Market. And if the market is falling right now, read The Market Just Dropped 20%. Here's What Calm Investors Do Next before you touch anything.
Catch No. 2: You Need All 20 Years, Not Most of Them
The guarantee, such as it is, only works if you don't need the money in the middle.
Our 1929 investor was down 65% after four years and still below even after 15 years. If they had needed that money for a house deposit in 1932 or a hospital bill in 1942, the long-term numbers wouldn't have helped them at all.
That's why money you need within the next five years doesn't belong in the stock market. Keep it in cash or high-quality short-term bonds, where a crash can't force you to sell.
This matters even more if you're in your 50s or 60s. You may be investing for 20 years or longer, but you'll start spending some of it sooner. If you're rebuilding later in life, I wrote You Lost Money in the Stock Market at 50. Is It Too Late to Retire Comfortably? for you.
Catch No. 3: Fees, Taxes and Where You Live
The numbers in this article have no costs taken out. Your real-world result depends on what you pay.
A cheap index fund costs a tiny fraction of 1% a year. Many actively managed funds and unit trusts charge several times that, plus sales charges, and over 20 years that gap can swallow a huge chunk of your gains.
If you live outside the United States, you have extra traps to watch: US tax withheld from your dividends, and in some cases US estate tax. Both can be reduced by choosing the right type of fund. I explain how in How to Invest in the S&P 500 If You Live Outside the United States.
Catch No. 4: The Past Is Not a Promise
This is the most important catch, so I'll be blunt.
America's stock market had one of the best centuries of any major market in modern history. Investors in other countries were not always so lucky.
Japan is the classic warning. On December 29, 1989, the Nikkei 225 closed at a record 38,915.87. It didn't close above that level again until February 22, 2024, more than 34 years later. A Japanese investor who bought the index at the top waited a third of a century just to get back to even on price, although dividends softened the blow.
Germany and Japan also saw their stock markets collapse after World War II. These things happen.
And today's starting point matters. In its forecast run as of September 30, 2026, Vanguard expected US stocks to return about 4.8% to 6.8% a year over the next 10 years. That's well below the 10.90% typical 20-year result in this article. Lower returns aren't losses, but they're a reason to keep your expectations sober.
The Honest Bottom Line History gives the S&P 500 a remarkable 20-year record: 81 periods, no losses, before or after inflation. It does not give you a guarantee. The smart response is to stack the odds in your favour: hold for decades, keep costs low, never invest money you'll need soon, and don't make the US your only bet if your situation calls for more spread. |
What If You Invested Every Month Instead?
Most people don't invest one lump sum and walk away. They put in a bit every month from their salary.
That approach makes the 20-year record look even stronger. In What $500 a Month in an S&P 500 Index Fund Becomes After 10, 20 and 30 Years, I tested every 20-year stretch since 1928. Not one ended with less than the $120,000 deposited. The worst still finished with $181,613. The typical one finished with about $415,661.
Monthly investing helps because every crash becomes a sale. When prices fall, the same $500 buys more shares, and those cheap shares do the heavy lifting in the recovery.
Not sure whether to put a lump sum in all at once or spread it out? I compare both, with real numbers, in Lump Sum or Monthly? How to Put Money Back Into the Market After a Big Loss.
Every 20-Year Period Since 1926
Here is the full record, so you can find the 20 years you care about. Each row shows $10,000 invested at the start of the first year with dividends reinvested, and what it became by the end of the last year.
Period | Per year | After inflation | $10,000 became |
|---|---|---|---|
1926 to 1945 | 6.41% | 6.33% | $34,627 |
1927 to 1946 | 5.36% | 4.35% | $28,407 |
1928 to 1947 | 3.96% | 2.41% | $21,735 |
1929 to 1948 | 2.37% | 0.63% | $15,975 |
1930 to 1949 | 3.68% | 2.06% | $20,610 |
1931 to 1950 | 6.61% | 4.30% | $36,003 |
1932 to 1951 | 10.91% | 7.66% | $79,290 |
1933 to 1952 | 12.34% | 8.42% | $102,540 |
1934 to 1953 | 10.02% | 6.19% | $67,542 |
1935 to 1954 | 12.44% | 8.64% | $104,283 |
1936 to 1955 | 11.87% | 8.23% | $94,234 |
1937 to 1956 | 10.73% | 7.04% | $76,736 |
1938 to 1957 | 12.54% | 8.79% | $106,262 |
1939 to 1958 | 13.14% | 9.12% | $118,131 |
1940 to 1959 | 13.85% | 9.71% | $133,850 |
1941 to 1960 | 14.51% | 10.31% | $150,348 |
1942 to 1961 | 16.67% | 12.88% | $218,274 |
1943 to 1962 | 15.12% | 11.79% | $167,025 |
1944 to 1963 | 15.00% | 11.75% | $163,753 |
1945 to 1964 | 14.88% | 11.70% | $160,162 |
1946 to 1965 | 13.79% | 10.66% | $132,545 |
1947 to 1966 | 13.70% | 11.30% | $130,316 |
1948 to 1967 | 14.63% | 12.52% | $153,356 |
1949 to 1968 | 14.90% | 12.69% | $160,770 |
1950 to 1969 | 13.45% | 10.82% | $124,702 |
1951 to 1970 | 12.13% | 9.55% | $98,725 |
1952 to 1971 | 11.68% | 9.25% | $91,173 |
1953 to 1972 | 11.71% | 9.14% | $91,644 |
1954 to 1973 | 10.92% | 7.96% | $79,492 |
1955 to 1974 | 6.99% | 3.49% | $38,610 |
1956 to 1975 | 7.16% | 3.33% | $39,891 |
1957 to 1976 | 7.93% | 3.97% | $45,977 |
1958 to 1977 | 8.13% | 3.98% | $47,763 |
1959 to 1978 | 6.52% | 2.09% | $35,397 |
1960 to 1979 | 6.82% | 1.82% | $37,438 |
1961 to 1980 | 8.29% | 2.68% | $49,153 |
1962 to 1981 | 6.76% | 0.84% | $36,989 |
1963 to 1982 | 8.25% | 2.13% | $48,846 |
1964 to 1983 | 8.24% | 2.01% | $48,738 |
1965 to 1984 | 7.74% | 1.39% | $44,439 |
1966 to 1985 | 8.58% | 2.09% | $51,887 |
1967 to 1986 | 10.08% | 3.62% | $68,290 |
1968 to 1987 | 9.22% | 2.74% | $58,366 |
1969 to 1988 | 9.50% | 3.01% | $61,384 |
1970 to 1989 | 11.48% | 4.96% | $87,956 |
1971 to 1990 | 11.12% | 4.59% | $82,333 |
1972 to 1991 | 11.85% | 5.29% | $93,874 |
1973 to 1992 | 11.29% | 4.79% | $84,965 |
1974 to 1993 | 12.69% | 6.41% | $109,040 |
1975 to 1994 | 14.47% | 8.57% | $149,110 |
1976 to 1995 | 14.47% | 8.81% | $149,327 |
1977 to 1996 | 14.42% | 8.84% | $147,941 |
1978 to 1997 | 16.49% | 11.07% | $211,685 |
1979 to 1998 | 17.58% | 12.51% | $255,071 |
1980 to 1999 | 17.70% | 13.18% | $260,172 |
1981 to 2000 | 15.54% | 11.57% | $179,655 |
1982 to 2001 | 15.09% | 11.52% | $166,177 |
1983 to 2002 | 12.62% | 9.20% | $107,679 |
1984 to 2003 | 12.89% | 9.57% | $112,978 |
1985 to 2004 | 13.13% | 9.83% | $117,863 |
1986 to 2005 | 11.86% | 8.62% | $94,145 |
1987 to 2006 | 11.73% | 8.42% | $91,857 |
1988 to 2007 | 11.71% | 8.41% | $91,570 |
1989 to 2008 | 8.36% | 5.39% | $49,855 |
1990 to 2009 | 8.13% | 5.26% | $47,755 |
1991 to 2010 | 9.05% | 6.39% | $56,563 |
1992 to 2011 | 7.73% | 5.11% | $44,345 |
1993 to 2012 | 8.14% | 5.57% | $47,810 |
1994 to 2013 | 9.14% | 6.60% | $57,453 |
1995 to 2014 | 9.76% | 7.31% | $64,365 |
1996 to 2015 | 8.11% | 5.79% | $47,561 |
1997 to 2016 | 7.61% | 5.36% | $43,331 |
1998 to 2017 | 7.12% | 4.87% | $39,590 |
1999 to 2018 | 5.57% | 3.33% | $29,543 |
2000 to 2019 | 6.00% | 3.77% | $32,065 |
2001 to 2020 | 7.39% | 5.24% | $41,600 |
2002 to 2021 | 9.43% | 6.96% | $60,628 |
2003 to 2022 | 9.70% | 7.01% | $63,681 |
2004 to 2023 | 9.60% | 6.84% | $62,540 |
2005 to 2024 | 10.26% | 7.50% | $70,526 |
2006 to 2025 | 10.90% | 8.17% | $79,238 |
A few things jump out when you scan it.
The weakest results cluster in two places: periods that started just before the 1929 crash, and periods that started in the late 1950s and early 1960s and ran straight into the 1970s inflation. The strongest results almost all include the 1980s and 1990s.
And not a single row has a minus sign.
The 20-Year Rule: How to Use This With Your Own Money
Data is only useful if it changes what you do. Here's how I'd turn this into a simple plan.
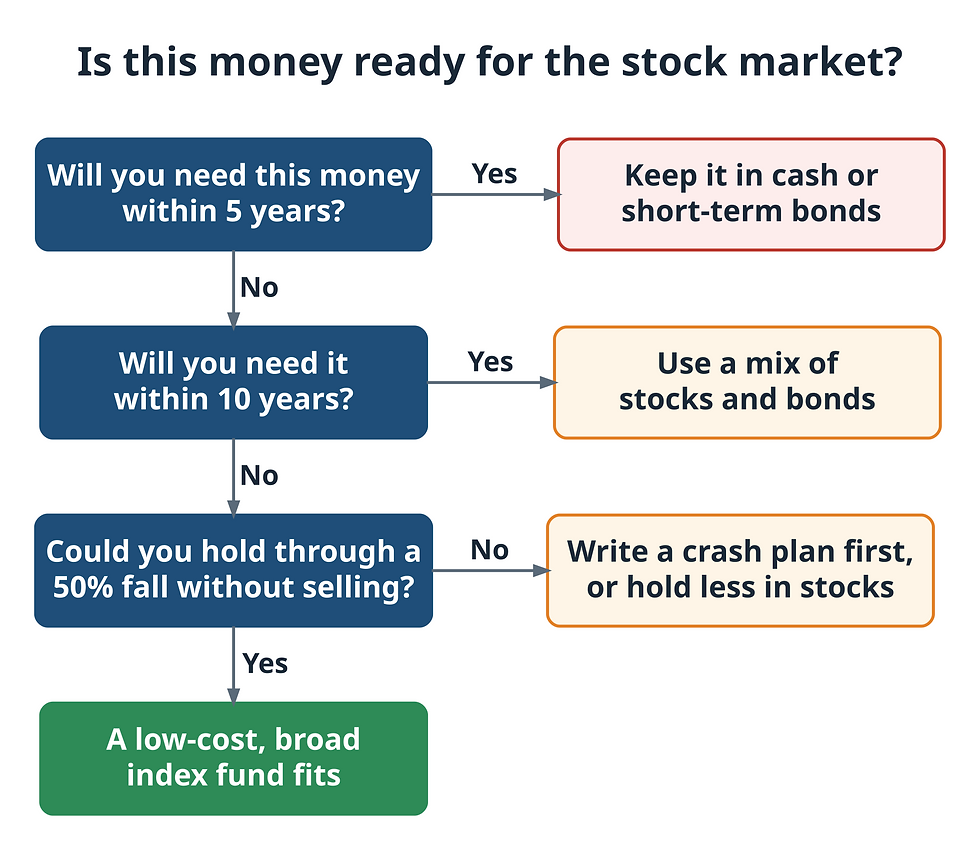
Sort your money by when you'll need it. Make three piles: money for the next 5 years, money for 5 to 10 years, and money you won't touch for 10 to 20 years or more.
Protect the short-term pile. Money for the next 5 years goes in cash or high-quality short-term bonds. That's what keeps you from being a forced seller in a crash.
Let the long-term pile do the heavy lifting. Money you won't need for 20 years is where a low-cost, broad index fund has historically shined.
Mix the middle. For 5 to 10 years, a blend of stocks and bonds makes sense, because 10-year stock periods have lost money before.
Decide your crash plan now, in writing. Write down what you'll do if your portfolio falls 30% or 50%. The answer should be "keep investing as planned." Sign it.
Automate it. Set up a monthly transfer so investing happens whether the news is good or terrifying.
Measure in decades, not days. Check your account a few times a year, not a few times a day.
If you're starting over after a painful loss, my full beginner's walkthrough is Index Funds for People Who've Been Burned: A Plain-English Guide to Starting Over. And if you're worried about what happens to your money if a fund company fails, read Is Your Money Safe in an Index Fund?
What to Do Tonight ☐ Write down when you'll need each part of your money: under 5 years, 5 to 10 years, 20 years or more. ☐ Check that next year's spending money isn't sitting in stocks. ☐ Look up the yearly cost (the expense ratio) of every fund you own. ☐ Write one sentence: "When the market crashes, I will…" and finish it. ☐ Save this article so you can reread the table the next time the headlines scream. |
Frequently Asked Questions
Has the S&P 500 ever had a negative 20-year return?
No. In all 81 rolling 20-year periods from 1926 to 2025, measured by calendar year with dividends reinvested, the S&P 500 made money every time. The worst was 1929 to 1948, which still gained 2.37% a year and turned $10,000 into $15,975.
What is the worst 20-year return of the S&P 500?
The weakest 20-year period since 1926 ran from January 1929 to December 1948, covering the Great Crash, the Depression and World War II. It returned 2.37% a year with dividends, or 0.63% a year after inflation. $10,000 grew to $15,975.
What is the average 20-year return of the S&P 500?
Across all 81 rolling 20-year periods since 1926, the median return was 10.90% a year with dividends reinvested, or 6.96% a year after inflation. At 10.90%, $10,000 grows to about $79,000 in 20 years. Results ranged from 2.37% to 17.70% a year.
Has the S&P 500 ever lost money over 10 years?
Yes. Five of the 91 rolling 10-year periods since 1926 lost money, including 1929 to 1938 and the "lost decade" of 2000 to 2009, which fell about 9% even with dividends. That's why 10 years is a minimum for stock money, not a guarantee.
Has the S&P 500 ever lost money over 20 years after inflation?
Not since 1926. All 81 rolling 20-year periods beat inflation, though 1929 to 1948 and 1962 to 1981 gained less than 1% a year in real terms. A Schroders study going back to 1871 found one real 20-year loss, from 1901 to 1921.
Is it safe to put all my money in the S&P 500 for 20 years?
History strongly favours a 20-year holder, but nothing is guaranteed. Japan's market took 34 years to regain its 1989 peak. Keep money you'll need within five years out of stocks, keep costs low, and consider whether broader diversification fits your situation.
How long did it take the stock market to recover from 1929?
The Dow's price didn't regain its 1929 high until November 1954, 25 years later. But counting dividends and the deflation of the 1930s, research by Mark Hulbert found investors were back to even by late 1936. In our data, a January 1929 investor was above even by 1936 and for good by 1944.
About the Author
Stephen Loke has been a student of the market for more than 15 years. He is also an agritourism entrepreneur whose farm has been featured in Bloomberg News and Asahi Shimbun.
This article is general education, not personal financial advice. I'm not a licensed financial adviser. Past returns don't guarantee future results. Please consider your own situation, or speak with a licensed professional, before making investment decisions.
Twenty Years Is a Long Time. That's the Whole Point.

If you've lost money in the stock market, you probably lost it over months, not decades. A bad tip. A crash you panicked through. A "sure thing" that wasn't.
The S&P 500's 20-year record tells a different story. Through a depression, a world war, runaway inflation, two crashes in one decade and a pandemic, every 20-year holder since 1926 came out ahead.
The market didn't get easier during those years. The investors who won simply gave it enough time, and didn't let fear end their 20 years early.
You still have time to be one of them.
Free Report for Investors Who've Been Burned "Why You Lost Money in the Stock Market (And Why It Wasn't Your Fault)" is my free 38-page report for investors over 40 who've been burned and want to build real wealth for retirement. Inside, you'll discover the 7 Wall Street traps that quietly drain ordinary investors, and the one boring strategy the industry hopes you never discover. Instant download. 100% free. |
Sources
CIBC Wood Gundy (citing Dimensional and Slickcharts): 1926 S&P 500 total return of 11.62%
US Inflation Calculator: Historical inflation rates from the BLS Consumer Price Index
Bloomberg, John Steele Gordon: How the Dow Distorts the History of Wall Street
Schroders, Duncan Lamont: The data that shows a case for long-term investing (April 2020)
Barry Ritholtz: Death of Equities, 40th Anniversary (on the 1979 BusinessWeek cover)
Boston Globe / Associated Press: Japan's Nikkei breaks its 1989 record (February 22, 2024)
Claremont Courier, Donald Gould: 100 Years of market history (June 2026)
Vanguard: Setting realistic expectations, 10-year return forecasts (as of September 30, 2026)



Comments