The Market Just Dropped 20%. Here's What Calm Investors Do Next


On the morning of Tuesday, October 20, 1987, millions of people opened their newspaper to a headline they would remember for the rest of their lives.
The New York Times ran it across the top of the front page: "Stocks Plunge 508 Points, a Drop of 22.6%." (Yale Program on Financial Stability archive) The day before, Black Monday, the Dow Jones Industrial Average had suffered the biggest one-day percentage fall in its history. The S&P 500 lost about 20% in a single session. (Wikipedia: Black Monday)
Picture the kitchen tables that morning. Coffee going cold. Someone staring at the business section, doing sums in the margin. And the question every household was asking: "Should we sell before it gets worse?"
Here is what happened next. The S&P 500 hit its low on December 4, 1987, and was back at a record high by July 26, 1989. (Stacker via KEYT) The people who sold that week locked in some of the worst prices of the decade. The people who sat still, and especially the ones who kept buying, went on to enjoy one of the greatest bull markets in history.
Every generation gets its own version of that morning. 1987. 2000. 2008. March 2020. 2022. April 2025. Even this year, when war broke out at the end of February, the S&P 500 slid as much as 9% before closing at a fresh record on April 15, 2026. (Reuters via Yahoo Finance)
So let's talk about what you do when the screen turns red and the market is down 20%.
Not what you feel like doing. What calm, seasoned investors actually do. The moves the research says protect and build wealth, and the mistakes that quietly destroy more retirements than any crash ever has.
If you're reading this in the middle of a crash, take a breath. You're in the right place. If you're reading it on a calm day (in early October 2026, the major U.S. indexes are testing all-time highs again, according to Equity Clock), even better. This is your fire drill. Fire drills are practised when the building is not on fire.
The 30-second version A 20% drop is normal. The S&P 500 has had 27 bear markets since 1928, roughly one every 3.5 years on average. They end faster than they feel. The average bear market has lasted about 9.6 months. The average bull market, about 2.6 years. Selling is the expensive part. 401(k) savers who dumped all their stocks in the 2008–09 crash saw their balances grow just 2% by mid-2011. Those who stayed invested grew 50%. Calm investors follow a plan. Pause, check your cash, keep investing, rebalance, harvest tax losses, and write it all down so fear never gets a vote. |
In This Guide
First, Breathe: A 20% Drop Is Normal
Wall Street has a name for a fall of 20% or more from a recent high: a bear market. A fall of 10% is a correction. The labels are arbitrary. Nothing magical happens at exactly 20%. But they are useful, because they let us look back over almost a century and ask a simple question: how often does this happen, and how does it usually end?
Hartford Funds crunched the S&P 500's numbers going back to 1928. Here is what they found. (Hartford Funds)
There have been 27 bear markets since 1928.
They have arrived about every 3.5 years on average, and less often since World War II, about once every 5.1 years.
Stocks have lost about 35% on average in a bear market.
The average bear market has lasted 289 days, about 9.6 months.
The average bull market has lasted 965 days, about 2.6 years, and gained about 111%.
Over a 50-year investing life, you can expect to live through roughly 14 bear markets.

Read that last line again. Fourteen. If you are 45 today and live into your 90s, you will very likely sit through another dozen of these. The question is not whether the next 20% drop is coming. It is. The only question is what you will do when it arrives.
Here is the detail that changes everything: about 42% of the S&P 500's strongest days over the past 20 years happened during bear markets. (Hartford Funds) The rescue usually arrives in the middle of the storm, not after the sky has cleared.
The veteran's rule A bear market is not a bill you pay once. It is the admission price for long-term stock returns, charged every few years. Investors who accept the fee in advance stay calm. Investors who think they can dodge it often end up paying twice: once on the way down, and again by missing the way back up. |
Every Crash in Living Memory Ended the Same Way
Let me walk you through the big ones. Not to frighten you. To show you the pattern, because once you see it, you can't unsee it.
1987: The one-day crash
You've met this one already. Including the weeks before and after Black Monday, the S&P 500 fell 33.5% from its August 1987 peak to its December low. It was back at a record about 20 months after the bottom. (Stacker via KEYT)
2000–2002: The dot-com bust
This is the painful one, and I won't pretend otherwise. The S&P 500 fell 49.1% between March 2000 and October 2002 and didn't regain its old high until May 30, 2007. (Stacker via KEYT) People who had piled into a handful of hot internet stocks saw some of them vanish forever. A broad index of 500 companies came back.
2007–2009: The financial crisis
The S&P 500 closed at 1,565.15 on October 9, 2007. By March 9, 2009, it had fallen to 676.53, roughly 57% lower, and it took until March 28, 2013, to set a new record. (ETF Trends) Brutal. Yet investors who reinvested their dividends were made whole sooner than the price chart suggests, and anyone who kept buying at 2009 prices did spectacularly well.
2020: The COVID crash
The S&P 500 plunged 34% from its February 19 peak to its March 23 low. On one day, the Dow fell nearly 3,000 points, about 13%, and trading halts kicked in again and again. Then, on August 18, 2020, with unemployment still above 10%, the S&P 500 closed at a record high. (NPR) About five months from the bottom to a record.
2022: The inflation bear market
From its record on January 3, 2022, to its low on October 12, the S&P 500 fell 25.4%. The Associated Press noted that was milder than the average bear market since 1950, which lasted 13 months and cut 34.2%. (AP via The Boston Globe) A new record arrived on January 19, 2024. (Reuters via Investing.com)
2025: The bear market that almost was
New tariffs were announced on April 2, 2025. By April 8, the S&P 500 had closed 18.9% below its February high, a whisker from bear territory. (Sherwood News) The very next day it soared 9.5%, its best day since 2008, and according to Dow Jones Market Data it went on to stage the fastest recovery on record from a 15% drop back to an all-time high. (Broadway Bank) By June 27, 2025, it was at a record again. (AP via ColoradoBiz)
Think about that for a moment. Anyone who sold on April 8 to "stop the bleeding" missed a 9.5% gain the very next day.

What this means for you Six crashes. Six different causes: computer-driven selling, a tech bubble, a banking collapse, a pandemic, inflation and a trade war. Every one of them felt like "this time is different." In every case on this list, the S&P 500 went on to a new record. Past results never guarantee future ones, and a single stock can go to zero. But betting that a broad, diversified index will never recover has been one of the most reliably expensive bets in finance. |
Why Your Brain Screams "Sell!" (And Why It Is Lying)
If history is so clear, why do so many intelligent people sell at the bottom?
Because your brain was built for the savannah, not the stock market. In their famous work on prospect theory, psychologists Daniel Kahneman and Amos Tversky showed that losses hit us roughly twice as hard as equal-sized gains. (EPFL Graph Search) So when a $500,000 nest egg drops to $400,000, the $100,000 that vanished can hurt as much as a $200,000 windfall would feel good. That pain demands action. Selling feels like action. It feels like safety.
Now here is the study that should make every reader over 45 sit up straight.
A team of researchers including MIT's Andrew Lo examined 653,455 brokerage accounts belonging to 298,556 U.S. households between 2003 and 2015. They looked for "freak-outs," which they defined as a household dumping 90% or more of its stock holdings within a month, mostly through selling. (MIT DSpace)
Here is what they found:
Panic selling is rare at any given moment, but it happens at up to three times the normal rate right after big market moves. (Timeline)
The people most likely to freak out were male, over 45, married, with more dependents, or who described their own investing experience as excellent. (SSRN, via Evidence Investor)
31% of panic sellers never went back into stocks at all, and many who did waited so long that they missed the rebound. (Evidence Investor)
Read that profile again. Over 45. Married. Kids. Experienced. That isn't a reckless gambler. It is a responsible person who feels the weight of a family depending on them. The urge to "protect the family" by selling everything is the very thing that does the family's future the most harm.
If you're over 45, this study is about you The investors most likely to panic sell are not beginners. They are experienced, responsible people with families. Knowing that in advance is your edge. When you feel the urge to "do something," recognise it for what it is: a well-meaning instinct firing at exactly the wrong moment. |
If the stress is already keeping you up at night, read Can't Sleep After a Big Stock Loss? 9 Things to Do Before You Touch Your Portfolio Again. And if you want to understand the other mental traps that catch clever people, see Why Smart People Lose Money in the Stock Market.
The Panic Seller's Trap: You Have to Be Right Twice
Selling in a crash isn't one decision. It's two. You have to be right about when to get out, and then right again about when to get back in. Most people who get the first one "right" never get the second one right at all.
Fidelity Investments studied exactly this after the 2008 crash. It looked at 401(k) savers who moved their stock allocation to zero between October 1, 2008, and March 31, 2009, the darkest months of the crisis. (CBS News)
Savers who sold out and stayed out saw their balances grow just 2% by June 30, 2011.
Savers who sold and later went back in grew 25%.
Savers who simply stayed invested grew 50%.
Savers who kept contributing through the crash grew 64%, versus 26% for those who stopped.

The gap kept widening with time. Fidelity later reported that over the 12 years after the crisis, to December 2021, the accounts of savers who had moved completely out of stocks grew 389%, largely thanks to their continued contributions, while the accounts of those who stayed invested grew 650%. (Fidelity)
Why is getting back in so hard? Because the market's best days tend to arrive right next to its worst days, while the fear is still raw. J.P. Morgan Asset Management found that seven of the S&P 500's ten best days over a recent 20-year stretch came within two weeks of the ten worst days. (401(k) Specialist) Its research also showed that $10,000 left in the S&P 500 from January 2005 to December 2024 grew to about $71,750, but miss just the ten best days and you ended with about $32,871. (J.P. Morgan Asset Management)
The legendary Fidelity fund manager Peter Lynch put it bluntly: investors have lost far more money preparing for corrections, or trying to sidestep them, than they have lost in the corrections themselves. (A Wealth of Common Sense)
If you're already sitting on losses and wrestling with whether to sell, this will help: Should You Sell at a Loss or Wait to Break Even? A Calm Way to Decide.
"I'll wait for the dip to finish" is the most expensive sentence in investing
The cousin of panic selling is panic waiting: sitting in cash, convinced a better price is just around the corner.
Charles Schwab's research team tested this with five imaginary investors, each given $2,000 at the start of every year for the 20 years from 2005 to 2024. (Charles Schwab)
Peter Perfect invested at the market's lowest close every single year. He ended with $186,077.
Ashley Action simply invested on the first trading day of each year: $170,555.
Matthew Monthly split his money into 12 monthly purchases: $166,591.
Rosie Rotten had the worst luck imaginable and invested at each year's peak: $151,343.
Larry Linger kept waiting for a better moment and stayed in Treasury bills: $47,357.
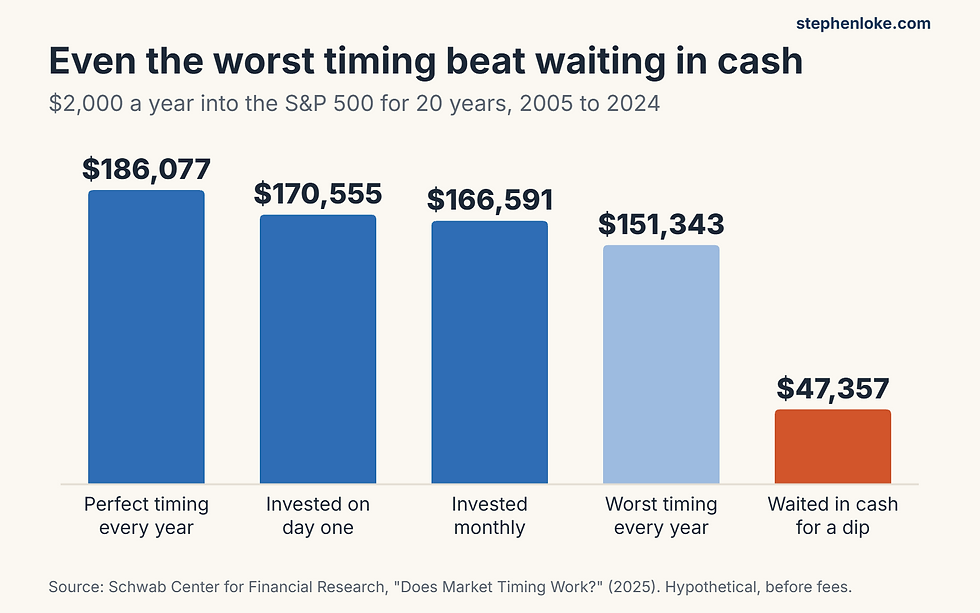
Look at Rosie. She bought at the top, every year, for 20 years, and still ended with more than three times as much as Larry. Schwab ran all 80 rolling 20-year periods back to 1926, and in 70 of them the ranking came out exactly the same. Perfect timing earned Peter only about $15,500 more than Ashley over two decades. That's roughly $700 a year in exchange for the impossible task of calling the bottom every single time.
Real Stories From the Front Lines of Panic
Numbers persuade the head. Stories persuade the heart. Here are four true stories of people who stayed calm when everyone around them was panicking.
The young man who bought 104 stocks as World War II began
In 1939, with Europe sliding into war and the Great Depression still fresh in everyone's mind, a young investor named John Templeton borrowed $10,000 and told his broker to buy 100 shares of every company on the exchange trading below $1. There were 104 of them, and 34 were in bankruptcy. (The New York Sun) Several years later he had made a profit on all but four of them. (ThinkAdvisor) He went on to become one of the most celebrated investors of the century.
Buffett's "Buy American. I Am."
On October 16, 2008, with banks failing and markets swinging wildly, Warren Buffett wrote an opinion piece for the New York Times titled "Buy American. I Am." He revealed that his personal account, which had held only U.S. government bonds, was now buying American stocks, and that his non-Berkshire wealth could soon be entirely in U.S. equities. His reason was a rule he has lived by for decades: "Be fearful when others are greedy, and be greedy when others are fearful." (The New York Times)
Here's the part people forget. He was early. He admitted in the same piece that he could not predict short-term moves (MarketPulse), and stocks kept falling for almost five more months, bottoming on March 9, 2009. Buffett didn't need to catch the bottom. He needed only to buy good businesses at sensible prices and hold them while the world recovered.
The magazine cover that said stocks were dead
On August 13, 1979, BusinessWeek ran one of the most infamous covers in financial journalism: "The Death of Equities." The Dow was stuck around 875, inflation was near 9%, and the magazine reported that at least 7 million shareholders had abandoned the stock market since 1970. (Humble Dollar) The great bull market began three years later, in August 1982 (Crossing Wall Street), and within 20 years the Dow had climbed to around 11,000. (AOL / DailyFinance)
When the headlines are at their gloomiest, prices are usually at their cheapest.
The retired tax auditor who left $22 million
Anne Scheiber worked as an auditor for the U.S. Internal Revenue Service and never earned more than $4,000 a year. She retired in 1944, lived frugally in a rent-controlled apartment and let her stocks grow with a simple buy-and-hold approach. When she died in 1995 at the age of 101, she left $22 million to Yeshiva University to fund scholarships for women. (Wikipedia, citing The New York Times) Newspapers at the time said she began with about $5,000 (The Detroit Jewish News, 1996); later analysis of her tax records suggests her stake was closer to $21,000 a few years before she retired. Either way, her portfolio lived through every crash of that half-century, including the 1973–74 bear market and Black Monday, and she kept holding.
The common thread None of these people predicted the bottom. What they had was cash they didn't need in a hurry, a long time horizon, and the nerve to keep owning good businesses while others were selling. You don't need Templeton's genius or Buffett's billions. A low-cost, broadly diversified index fund and a written plan will get you most of the way there. |
The Recovery Math Nobody Explains
Here is a piece of arithmetic every investor should know by heart. When you lose money, you need a bigger percentage gain just to get back to where you started.

A 20% fall needs a 25% rise to break even. A 50% fall needs 100%. This math teaches two lessons at once.
Lesson one: avoid the losses that don't heal. Borrowed money, concentrated bets on one or two stocks and "get it back fast" trades turn a temporary 20% dip into a permanent 50% hole. That's how investors get wiped out, not by owning a diversified index through a bear market. I've written about how this spiral starts in The Revenge Trade: How a $50K Loss Quietly Becomes $200K.
Lesson two: the rebound is often faster than you think. Since World War II, the S&P 500 has gained an average of 12.4% in the year after first entering a bear market, compared with its long-run average of about 7.5% a year. (The Motley Fool) That isn't a promise. Investors who bought in late 1973 fell another 28% over the following year. But on average, the year after a 20% drop has been a better time to own stocks, not a worse one.
For the deeper math on big losses, see How Long Does It Take to Recover From a 50% Stock Market Loss?
What Calm Investors Actually Do Next: The 7-Step Playbook
Enough history. Here is exactly what to do, in order, the next time the market falls 20%. Print it. Stick it on the fridge. Read it before you open your trading app.

Step 1: Pause for 72 hours
Make no trades for three full days. Turn off price alerts. Delete the trading app from your phone's home screen. Limit the market news to once a day. Panic sales cluster right after big drops, and almost none of them look wise a year later. A 72-hour rule doesn't cost you anything. It simply puts a speed bump between your feelings and your money.
Step 2: Check your cash runway
Ask one question: how many months could I live without selling a single share? If you're working, aim for three to six months of expenses in a safe savings account. If you're retired, aim for one to two years of spending in cash, after counting any pension or other guaranteed income. (CNBC via NBC Los Angeles) Cash is what lets you wait. People rarely sell at the bottom because they want to. They sell because they have to.
Step 3: Sort your money by its due date
Money you'll need within about five years (a house deposit, a child's tuition, next year's living costs) doesn't belong in stocks. If a crash reveals that some of your short-term money is sitting in the market, that's the one legitimate reason to adjust, gently and gradually, once the 72 hours are up. Everything you won't need for ten years or more can afford to ride out the storm.
Step 4: Keep investing on schedule
If you invest every month through your salary, your retirement fund or an automatic plan, don't stop. Remember Fidelity's numbers: savers who kept contributing through 2008–09 grew their balances 64%, versus 26% for those who stopped. (PlanSponsor) Every dollar you invest during a bear market buys more shares than it did a year earlier. Your reinvested dividends buy cheaper shares too. A crash is a sale, and you're already on the guest list.
Step 5: Rebalance back to your target
This is the professional's move, and it's the disciplined way to "buy low" without guessing.
Say your plan is 60% stocks and 40% bonds, on a $1,000,000 portfolio: $600,000 in stocks and $400,000 in bonds. Stocks fall 20%, so you now have $480,000 in stocks and $400,000 in bonds. Your total is $880,000, and stocks are only about 55% of it. To get back to 60%, you move roughly $48,000 from bonds into stocks.
You're selling what held up and buying what fell, mechanically, with no forecasting at all. A simple rule works well: rebalance once a year, or whenever your stock share drifts more than five percentage points from target.
Step 6: Harvest tax losses, where your rules allow
If you hold investments in a taxable account and your country taxes capital gains, a bear market can hand you a gift: losses you can use to cut future tax bills. You sell a fund that's down and immediately buy a similar but not identical fund, so you stay invested. In the United States, the "wash sale" rule disallows the loss if you buy the same or a substantially identical investment within 30 days before or after the sale. (IRS Publication 550) Rules vary a great deal by country, and some don't tax individual share gains at all, so check yours or ask a tax professional before you act.
Step 7: Write your one-page crash plan
Professional fund managers work from a written investment policy. You should too. Fear is very persuasive in the moment, but it's no match for a decision you made calmly, in writing, months earlier.
Your one-page crash plan (copy this) My target mix: ___% stocks, ___% bonds, ___% cash. My cash runway: ___ months of expenses in safe cash. When the market falls 20%, I will: pause for 72 hours, keep my monthly investing running, and rebalance if my stock share drifts more than 5 points from target. I will not: sell everything, borrow to "buy the dip," or use leveraged or inverse funds to win my losses back. I will only change this plan when: my life changes (job, health, family or retirement date), never because of a headline. Signed: ____________ Date: ____________ |
If You're 50+ or Retired: Two Extra Rules

If you're still working, a bear market is mostly an inconvenience, and even an opportunity. If you're close to retirement or already drawing an income from your savings, the stakes are higher, because selling shares at depressed prices to pay the bills can permanently shrink your nest egg.
Professionals call this sequence-of-returns risk. Morningstar's Amy Arnott describes the first five years of retirement as the "danger zone," when a market drop paired with withdrawals can raise the odds of outliving your money. (CNBC via NBC Los Angeles)
Rule 1: Build buckets, so you never sell stocks in a crash
The bucket approach, popularised by Morningstar's Christine Benz, splits your retirement money by when you'll need it:
Bucket 1: Cash. One to two years of living expenses, after counting guaranteed income such as a pension.
Bucket 2: Bonds. Roughly the next five years of spending, in short- to intermediate-term bonds, whose income refills Bucket 1.
Bucket 3: Stocks. Money you won't need for many years, there to grow faster than inflation.

When the market crashes, you live on Bucket 1 and leave your stocks alone. When markets are good, you top up the lower buckets from the higher ones. Even a plain balanced portfolio helps: Morningstar found that retirees who started withdrawing just before the 2000 crash fared much better with 60% stocks and 40% bonds, rebalanced annually. (Morningstar Australia)
Rule 2: Trim your spending a little, not your stocks a lot
In a bad year, skipping the holiday or the inflation raise on your withdrawals for a year or two can do far more for your long-term security than selling shares at a 20% discount. Small, temporary belt-tightening protects the engine that has to carry you for the next 25 or 30 years.
If a loss has already shaken your retirement plans, read You Lost Money in the Stock Market at 50. Is It Too Late to Retire Comfortably? and Down 50%? A 12-Month Plan to Rebuild Your Portfolio Without Taking Bigger Risks.
8 Things Calm Investors Never Do in a Crash
Sell everything after a big drop, then wait for "clarity" that only arrives after prices have recovered.
Stop their monthly contributions, the exact moment those contributions buy the most shares.
Check their portfolio every hour. The more often you look, the more losses you'll see, and the more pain you'll feel.
Borrow on margin to "buy the dip." Leverage turns a temporary fall into a forced sale.
Bet the house on one beaten-down stock. Diversify. Individual companies can and do go to zero.
Chase leveraged or inverse funds to win the money back quickly.
Take advice from headlines written to keep you watching, not to make you wealthy.
Keep the loss a secret from their spouse or partner. If that's you, here is how to tell your spouse you lost money in the stock market.
Panic Seller vs Calm Investor: Side by Side
Panic seller | Calm investor | |
|---|---|---|
First move | Sells to "stop the bleeding" | Pauses for 72 hours |
News habit | Checks prices every hour | Checks once a quarter |
Monthly investing | Stops contributing | Keeps buying, at lower prices |
Rebalancing | Never | Buys stocks back up to target |
Cash cushion | None, so forced to sell low | 6 to 24 months set aside |
Fidelity 401(k) result, 2008 to 2011 | +2% | +50% |
The Choice You Will Face Again
The market will drop 20% again. Maybe next year, maybe in five. When it does, you'll open your phone to a wall of red and a headline designed to make your heart race.
You'll have the same two choices as the readers of that 1987 newspaper.
You can do what feels safe: sell, sit in cash and wait for the all-clear. History says that all-clear tends to sound only after prices are much higher, and nearly a third of panic sellers in the MIT study never came back at all.
Or you can do what calm investors do. Pause. Check your cash. Keep investing. Rebalance. Follow the plan you wrote on a quiet Sunday afternoon. Then go for a walk, have dinner with your family and let time do the heavy lifting.
The first choice feels better for a week. The second one feels better for the rest of your life.
FREE REPORT: Why You Lost Money in the Stock Market (And Why It Wasn't Your Fault) You've just seen why calm investors come out of crashes ahead while panic sellers pay twice. My free report goes one step further. It reveals the 7 Wall Street traps that quietly drain ordinary investors, the "small" yearly fee that can swallow a fortune over time, what Warren Buffett told his own family to do with their inheritance, and the one boring strategy the industry hopes you never discover. It's written in plain English for investors over 40 who have lost money and want a calm, proven way to rebuild wealth for retirement. 100% free. Instant download. No credit card. |
Frequently Asked Questions
What should I do when the stock market drops 20%?
Start by doing nothing for 72 hours. Then check that you have enough cash so you won't be forced to sell, make sure money you need within five years isn't in stocks, keep your regular investments running, rebalance back to your target mix, and consider harvesting tax losses where your local rules allow. Write the plan down so you follow it next time without having to think.
Should I sell my stocks in a bear market?
For most long-term investors, selling everything in a bear market has historically been a costly mistake. Fidelity found that 401(k) savers who moved fully out of stocks during the 2008–09 crash grew their balances just 2% by mid-2011, versus 50% for those who stayed invested. The main exception is money you need within the next few years, which shouldn't have been in stocks in the first place.
How long do bear markets usually last?
According to Hartford Funds, the average S&P 500 bear market since 1928 has lasted 289 days, about 9.6 months, with an average decline of about 35%. The average bull market has lasted about 2.6 years and gained about 111%.
How long does it take the stock market to recover from a 20% drop?
It varies a lot. After the 2020 COVID crash, the S&P 500 reached a new record about five months after its low. After 2025's near-bear market, it took under three months. After 2022, about 15 months. After the 2007–09 financial crisis, it took about four years from the bottom to a new price record.
Is it a good time to buy after the market falls 20%?
Nobody can reliably time the bottom, but history has been kind to patient buyers. Since World War II, the S&P 500 has gained an average of 12.4% in the year after first entering a bear market, with exceptions such as 1973–74, when stocks kept falling. The calm approach is to keep investing regularly rather than trying to guess the exact low.
What is the difference between a correction and a bear market?
A correction is a fall of at least 10% from a recent high. A bear market is a fall of at least 20%. A crash usually describes a very fast, severe drop, such as Black Monday in 1987, when the Dow fell 22.6% in a single day.
Should I stop contributing to my retirement account during a crash?
Generally, no. Fidelity found that 401(k) savers who kept contributing through the 2008–09 crash grew their balances 64%, versus 26% for those who stopped. Contributions made during a bear market buy shares at lower prices.
What should retirees do when the stock market crashes?
Retirees face sequence-of-returns risk, so the priority is to avoid selling stocks at low prices to pay the bills. Many use a bucket approach: one to two years of spending in cash, roughly the next five years in bonds and the rest in stocks. In a crash, they spend from cash, trim discretionary spending and leave their stocks to recover. A licensed adviser can help tailor this to your situation.
Sources
Hartford Funds: 10 Things You Should Know About Bear Markets
Stacker via KEYT: Every major stock market correction since 1950 and how long recovery took
Reuters via Yahoo Finance: S&P 500 closes at fresh record (April 2026)
NPR: S&P 500 closes at record high six months after coronavirus plunge
AP via The Boston Globe: Wall Street exits the 2022 bear market
Sherwood News: Stocks reach new high after the 2025 tariff sell-off
Elkind, Kaminski, Lo, Siah and Wong: "When Do Investors Freak Out?" (MIT)
CBS News: 401(k) investors who stayed the course in 2008–09 were big winners
Warren Buffett, "Buy American. I Am." The New York Times, Oct. 16, 2008
Humble Dollar: Courage Required (BusinessWeek's "The Death of Equities")
CNBC via NBC Los Angeles: How the bucket strategy protects retirees in a downturn
Morningstar Australia: How to manage sequencing risk in retirement
Disclaimer: This article is for general education only and is not personalized financial, tax or legal advice. Investing involves risk, including the loss of principal. Past performance does not guarantee future results. Consider speaking with a licensed professional about your own situation.


Comments