Down 50%? A 12-Month Plan to Rebuild Your Portfolio Without Taking Bigger Risks


It usually happens at night.
You open the app "just to check," and there it is. The number you have been avoiding. The portfolio that took you 10, 15, maybe 25 years to build is worth half of what it was.
Your stomach drops. You do the math three times, hoping you got it wrong. You didn't.
Then the voices start. How could I be so stupid? Should I sell everything before it gets worse? Should I buy more to "average down"? What do I tell my partner? Am I going to have to work five more years?
If that is where you are right now, I want you to hear one thing before anything else: you are not the first person to sit in that chair, and the people who climbed out of it did not do it by being brave or clever. They did it by following a boring, written plan.
This article is that plan. Twelve months, four phases, one rule above all others: we rebuild without taking bigger risks. No options. No "one big trade to win it back." No hot tips from the group chat. Just the approach that the research, decade after decade, says actually works for ordinary people.
📌 Who this plan is for Investors who have lost 30%, 40%, 50% or more of their portfolio, whether from a market crash, a few stocks that collapsed, crypto, options, or a strategy that blew up. It is especially for people over 40 who still need their money to grow for retirement and can't afford a second disaster. This is education, not personal financial advice. Your situation is unique, so use it alongside a licensed, fee-only adviser if you can.
First, the Brutal Math (and Why It Lies to You)
Here is the number that keeps people awake.
When you lose 50%, you don't need a 50% gain to get back. You need 100%. A $100,000 portfolio that falls to $50,000 has to double just to get you home.

The losses get cruel fast. A 20% loss needs a 25% gain. A 30% loss needs about 43%. But a 60% loss needs 150%, and a 70% loss needs 233%.
Now watch what that math does to your brain. If you want to recover a 50% loss in three years with no new money, you would need to earn about 26% a year, every year. To do it in five years, you'd need nearly 15% a year.
Those numbers are why so many investors make their second, bigger mistake. They look at the hole, decide that "normal" returns are too slow, and start swinging harder: more concentration, more leverage, more speculation. The math is real. But the conclusion people draw from it is exactly backwards.
The answer to a deep hole isn't a bigger shovel. It's a longer ladder, built one steady rung at a time. I'll show you exactly how, including how regular contributions can cut a 10-year wait to about three.
If you want the full history of how long real recoveries have taken, from 1974 to 2009, read my companion piece: How Long Does It Take to Recover From a 50% Stock Market Loss?
You Are Not Stupid. You Are Human. Here's the Proof.
Before we fix anything, we need to stop the shame. Shame makes people hide, freeze or gamble. None of those help.
Here is what decades of research say about how normal, intelligent people behave with money.
Losses hurt about twice as much as gains feel good
In 1992, psychologists Amos Tversky and Daniel Kahneman (Kahneman later won a Nobel Prize for this line of work) estimated that people feel a loss roughly 2.25 times as strongly as an equal gain. A 2024 meta-analysis that pooled 607 estimates from 150 studies landed a bit lower, with the average between 1.8 and 2.1.
Either way, the message is the same. Losing $50,000 doesn't feel like the opposite of making $50,000. It feels like losing $100,000. That's why you can't sleep. That's why you can't think straight. Your brain is doing what human brains do.
The average investor quietly loses to their own funds
Every year, the research firm DALBAR measures how real investors do compared with the market they invest in. Their 2025 report found that in 2024 the S&P 500 returned 25.02%, while the average equity fund investor earned only 16.54%. That 8.48-point gap was the second-largest of the past decade, and the biggest withdrawals came just before a major surge.
Over 20 years, the damage compounds. DALBAR's figures show $100,000 invested at the S&P 500's return from 2005 to 2024 would have grown to about $716,880. At the average equity investor's return, it grew to about $585,644. That is $131,236 left on the table, not because of bad funds, but because of bad timing.

Morningstar's 2025 "Mind the Gap" study found the same pattern across US funds and ETFs over the 10 years to the end of 2024: the funds returned 8.2% a year, but the average dollar invested in them earned just 7.0%. That 1.2-point gap equals about 15% of the total return, lost to buying and selling at the wrong moments. And the funds whose investors traded the most had the widest gaps.
Experienced investors over 45 are the most likely to panic
This one surprises people. Researchers at MIT studied about 653,000 brokerage accounts from 2003 to 2015 to find out who "freaks out" and dumps their portfolio in a crash. The most likely panic-sellers were men, people over 45, married investors, people with dependents, and those who rated their own investment knowledge as good or excellent.
The finding that should stop you cold: 30.9% of the investors who panic-sold never went back into risky assets. They locked in the loss and missed the recovery that followed.
💡 The real lesson Feeling terrible after a big loss is not a sign that you are bad with money. It is the normal human response, and it hits experienced, responsible, family-minded people hardest. The goal of this plan is not to make you feel nothing. It is to make sure your feelings don't get to place the trades.
If the loss is keeping you up at night, start with this first: Can't Sleep After a Big Stock Loss? 9 Things to Do Before You Touch Your Portfolio Again.
The Mistake That Turns a 50% Loss Into an 80% Loss
When you're down half, there is a powerful urge to "win it back." I call it the revenge trade, and it destroys more wealth than the original crash.
The revenge trade has many faces: buying more of the stock that just collapsed, piling into the next hot sector, using margin, buying short-dated options, or putting "just a little" into a coin a friend swears by. They all share one feature. They increase risk precisely when your judgment is weakest.
Look at what the evidence says about concentrated bets:
Most individual stocks are losers over their lifetime. Professor Hendrik Bessembinder studied nearly 26,000 US stocks from 1926 to 2016. Just 4% of them (1,092 companies) accounted for all of the stock market's net wealth creation above Treasury bills. More than half of all stocks failed to beat one-month T-bills over their lifetimes.
Catastrophic losses are common, not rare. J.P. Morgan's "Agony & Ecstasy" research found that more than 40% of all stocks that were ever in the Russell 3000 Index since 1980 suffered a "catastrophic loss": a fall of 70% or more from their peak that was never recovered.
Most stocks lose to the index. In the same research, roughly two-thirds of individual stocks underperformed the broad index over their lifetimes, and only about one in ten became a true "megawinner."
Trading more makes it worse. In a famous study of 66,465 households, economists Brad Barber and Terrance Odean found the most active traders earned 11.4% a year while the market returned 17.9%. The least active households earned 18.5%.

Read that again with your own losses in mind. If you are down 50% in one or two stocks, the question is not "will it come back?" Some do. Many never do. The honest question is: "Knowing what I know today, would I buy this with fresh cash?" We'll use that test in Phase 2.
For a deeper look at how the spiral works, see The Revenge Trade: How a $50K Loss Quietly Becomes $200K.
The 12-Month Rebuild Plan at a Glance
Here is the whole plan on one page. Every phase has one job. Don't skip ahead. The order matters, because each phase makes the next one safer.
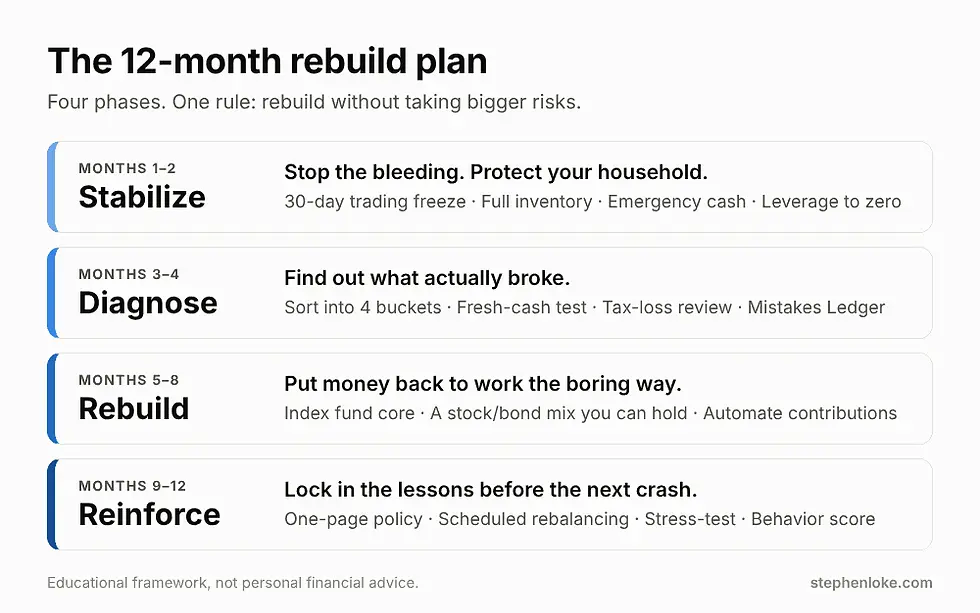
Phase 1, Months 1–2: Stabilize. Stop the bleeding, protect your household, remove anything that can force a sale.
Phase 2, Months 3–4: Diagnose. Figure out what actually broke, and separate temporary losses from permanent ones.
Phase 3, Months 5–8: Rebuild. Put money back to work the boring way: diversified, low-cost, automatic.
Phase 4, Months 9–12: Reinforce. Write your rules down, rebalance, and prepare for the next crash before it arrives.
Phase 1 (Months 1–2): Stabilize. Stop the Bleeding.
Month 1: Freeze, then take inventory
Rule #1: For the next 30 days, no new trades. No panic selling. No "averaging down." No new positions. The only exception is a forced situation, like a margin call, which we'll handle in a moment.
Why wait? Because the decisions you make in the first weeks after a big loss are the ones most likely to be driven by fear or the urge to get even. Hartford Funds, using Ned Davis Research data, counts 27 bear markets in the S&P 500 since 1928. The average one fell about 35% and lasted about 289 days, roughly 9.6 months. And here's the part that matters for a panicked investor: about 42% of the S&P 500's strongest days in the last 20 years happened during a bear market. Selling in a panic often means selling right before the bounce.
Use these 30 days to do three things:
Turn off price alerts and delete the trading app from your home screen. Checking ten times a day doesn't change the price. It just keeps your stress system switched on.
Build a complete inventory. List every holding: what you paid, what it's worth now, the percentage down, and in one sentence why you bought it. Be honest. "A friend recommended it" is a valid answer.
Tell the people who share your financial life. Secrets compound like debt. If you're dreading that conversation, this guide walks you through it: How to Tell Your Spouse You Lost Money in the Stock Market.
🧊 The 30-Day Freeze Rule Write this on a sticky note and put it next to your screen: "I will not make any investment decision for 30 days, except to remove leverage or protect my emergency money." The market will still be there in 30 days. So will every opportunity worth taking.
Month 1 (continued): Protect your emergency money first
Before you think about rebuilding, make sure you can never be forced to sell at the bottom again.
A 2025 Vanguard study of more than 12,000 investors found that having at least $2,000 in emergency savings was linked to about 21% higher financial well-being, even after accounting for income and wealth. Investors without emergency savings were far more likely to report that their financial stress had gone up over the past year (51%, versus 15% for those with at least $2,000 set aside).
Your target:
Step 1: Get to at least $2,000 (or the equivalent in your currency) in a separate savings account.
Step 2: Build toward 3–6 months of essential expenses. If you're self-employed, near retirement, or your income is unpredictable, lean toward 6–12 months.
Step 3: Any money you'll need in the next 3–5 years (a child's tuition, a house deposit, the first years of retirement) does not belong in stocks. Move it to cash or short-term, high-quality bonds as you reach that window.
This feels like it slows the rebuild down. It does the opposite. An emergency fund is what lets you keep your investments invested when life happens.
Month 2: Remove anything that can force you to sell
Some losses are painful. Others are dangerous. The dangerous ones come from anything that can force a sale at the worst moment.
Margin and leverage: If you're borrowing to invest, make a plan to pay it down to zero. Leverage turns a temporary loss into a permanent one, because a margin call sells for you at the bottom.
Options, leveraged ETFs, and anything that decays over time: Close them or let them expire. They are not recovery tools. (If options caused your loss, start here: Lost Your Savings Trading Options? What to Do in the First 30 Days.)
High-interest debt: Paying off a credit card charging 20% a year is a guaranteed 20% return. No investment on earth offers that with zero risk.
By the end of Month 2, you should be able to say: "Nothing in my financial life can force me to sell an investment in the next three years." That sentence is the foundation everything else stands on.
Phase 2 (Months 3–4): Diagnose. Find Out What Actually Broke.
Not all losses are the same, so they don't all get the same treatment. This is the step most people skip, and it's why so many of them repeat the same mistake.
Month 3: Sort every loss into one of four buckets

Bucket 1: Market losses. You owned broad, diversified index funds and the whole market fell. Historically these have been temporary. Every past S&P 500 bear market has eventually given way to a new high, though some recoveries took years. Usual action: stay invested and keep contributing.
Bucket 2: Concentration losses. You owned a handful of stocks, one sector, or one country, and that bet broke. These can be permanent. Remember the J.P. Morgan finding: more than 40% of stocks suffered a 70%+ fall they never recovered from. Even whole markets can stall. The tech-heavy Nasdaq Composite peaked at 5,048.62 in March 2000, fell nearly 78% by late 2002, and didn't close at a new high until April 2015, more than 15 years later. Usual action: apply the fresh-cash test below.
Bucket 3: Leverage losses. Margin, options, leveraged ETFs, CFDs. These losses are usually permanent, because the position was closed, expired, or decayed. The money isn't "down." It's gone. Usual action: accept it, close the door on leverage, and rebuild from your remaining capital.
Bucket 4: Speculation losses. Meme stocks, tips, small coins, things you bought because they were going up. Usual action: shrink this to a small, capped "play money" amount, or zero.
If you're down 50% while the broad market is near its highs, that is an important clue. The problem wasn't "the market." It was what you owned, or how you owned it.
The fresh-cash test
For every position in Buckets 2 and 4, ask: "If I had this amount in cash today, would I buy this exact investment, at this price, in this size?"
If yes, and you can explain why in two sentences without mentioning what you paid, you may keep it, but within the position limits in Phase 3.
If no, the price you paid is irrelevant. Economists call it a sunk cost. Holding a stock just to "get back to even" lets an old decision make a new one.
There's a detailed walkthrough of this decision here: Should You Sell at a Loss or Wait to Break Even? A Calm Way to Decide.
Month 4: Make your losses work for you at tax time
A realized loss can have real value. In the United States, for example, capital losses first offset capital gains, then up to $3,000 a year of ordinary income, and any remaining loss carries forward to future years. If you sell a losing position and want similar market exposure, the "wash sale" rule means you can't claim the loss if you buy the same or a substantially identical security within 30 days before or after the sale.
Rules differ a lot from country to country, and some places don't tax gains or allow losses on shares at all. Spend one hour with a qualified tax professional before you sell anything big. It can be the most profitable hour of the year.
Month 4 (continued): Start your "Mistakes Ledger"
Open a notebook or a document. For each loss, write three lines:
What I did. ("Put 40% of my portfolio into three tech stocks.")
Why I did it. ("They had gone up for two years and I was afraid to miss out.")
The rule that would have prevented it. ("No single stock above 5% of my portfolio.")
Those rules become your personal investment policy in Phase 4. This is how a painful loss becomes the most valuable tuition you ever paid.
Phase 3 (Months 5–8): Rebuild the Boring Way
Now we put money back to work. The goal isn't to be exciting. It's to be reliable.
The real engine of recovery: time plus contributions, not risk
Here's the chart I wish every investor saw the week after a crash.

Take a hypothetical portfolio that fell from $100,000 to $50,000, and assume it earns an average of 7% a year. That's an assumption, not a promise.
With no new money, it takes about 10 years to get the balance back to $100,000.
Add $250 a month and it takes about 6.3 years.
Add $500 a month: about 4.6 years.
Add $1,000 a month: about 3 years.
To be fair, part of that $100,000 is your own new savings, not recovered gains. That's not cheating. That's what rebuilding really looks like. Contributions do two things risk can't: they add to your balance with certainty, and when prices are low they buy more shares, which sets you up for the recovery.
Compare that with the "risk" route. To get back to $100,000 in three years without adding money, you'd need about 26% a year, every year. Steady contributions at ordinary returns get you to the same balance in about the same time, without betting your retirement on a hot streak.
✅ What "without taking bigger risks" means in practice No margin or borrowed money. No options or leveraged ETFs. No single stock above 5% of your portfolio. No "speculation" bucket above 5–10% of the total, and only money you could lose completely. No investment you can't explain in two sentences. Everything else is allowed.
Build a core you can't easily break
The core of your rebuilt portfolio should be broad, low-cost index funds: for example, a fund tracking the S&P 500, a total-market fund, or a global equity fund, paired with high-quality bonds for stability.
Why index funds rather than finding the next winner? Because the professionals mostly can't do it either. S&P Dow Jones Indices' SPIVA report found that in 2025, 79% of actively managed US large-cap funds underperformed the S&P 500, the fourth-worst year for active managers in the report's 25-year history. And Bessembinder's research tells you why: when only 4% of stocks drive all the gains, owning all of them is the surest way to own the 4%.
There's another, quieter reason. Morningstar found that investors in simple, broad allocation funds captured nearly 97% of their funds' returns, one of the smallest gaps in the study. Simple portfolios are easier to hold onto, and holding on is where the returns are.
I've written more about why the S&P 500 works so well for ordinary investors here: Why Your "Safe" Stocks Are Actually Costing You Thousands, and Why You Should Invest in the S&P 500.
Choose a stock-and-bond mix you can hold through the next crash
Here's a simple, honest test. History says a bear market comes along every 3.5 years or so on average, and the typical one takes stocks down about 35%. So ask yourself:
"If the stock part of my portfolio fell 35% next year, could I keep investing without selling?"
At 100% stocks, a 35% fall in stocks means roughly a 35% fall in your portfolio.
At 70% stocks / 30% bonds, the stock side alone would pull you down about 25%.
At 50/50, it's closer to 18%.
(These are rough illustrations of the stock side only; bonds can rise or fall too.)
There's no single "right" mix. A 45-year-old with 20 working years ahead can usually carry more stocks than a 62-year-old who retires in three. But the best mix for you is the one you will actually stick with when the headlines are screaming. A slightly "too safe" portfolio you hold beats a perfect one you panic out of.
Getting back in: all at once, or step by step?
If you're holding cash from sales or savings, you face a familiar question. Invest it now, or in pieces?
The evidence is clear on averages. Vanguard studied data from 1976 to 2022 and found that investing a lump sum right away beat spreading it over three months about 68% of the time, because markets rise more often than they fall. But the same research found that cost averaging still beat sitting in cash about 69% of the time.
Charles Schwab's long-running study makes the same point another way. Five hypothetical investors each received $2,000 a year for 20 years ending in 2024. The perfect market-timer, who somehow bought at the exact low every year, ended with $186,077. The investor who simply invested on day one every year ended with $170,555, only about 8% less, with zero skill required. The dollar-cost averager finished with $166,591. Even the investor with terrible timing finished far ahead of the one who waited in cash for the "right moment."
So here's my practical rule for someone who's just been burned:
Regular income → invest automatically every month, on payday, no decisions needed.
A lump of cash → if you can stomach it, invest it now. If you can't, split it into 3–6 equal monthly amounts and set them all up in advance, so fear can't cancel the last ones.
The worst choice is the one most burned investors make: waiting for "clarity." Clarity only shows up after prices have already recovered.
Months 7–8: Automate everything
By Month 8, your plan should run without you:
An automatic transfer into your investment account the day after payday.
Dividends set to reinvest.
Your trading app off the home screen. Check your balance once a month, on the same day, and only then.
Automation isn't laziness. It's the best defense against the behavior gap DALBAR and Morningstar keep measuring.
Phase 4 (Months 9–12): Reinforce. Lock In the Lessons.
The cost of jumping out, in one chart
When the market drops again (and it will), every instinct will tell you to get out and "wait for it to settle." This chart is why you shouldn't.
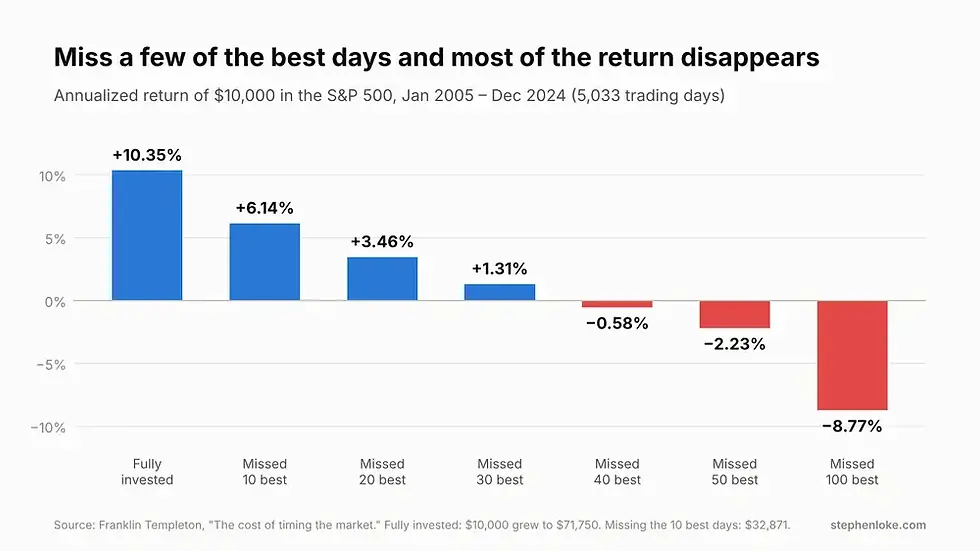
According to Franklin Templeton, $10,000 invested in the S&P 500 at the start of 2005 grew to $71,750 by the end of 2024, about 10.35% a year. Miss just the 10 best days out of more than 5,000 trading days, and it grows to only about $32,871, a return of 6.14% a year. Miss the best 40 days, and your return turns negative.
And the best days don't come on calm, sunny weeks. J.P. Morgan has found that most of the market's best days cluster within about two weeks of its worst days. If you're out during the storm, you usually miss the rescue too.
Month 9: Write your one-page Investment Policy
Professionals don't manage money from their gut. They use a written policy. You should too. One page is enough:
My goal: what this money is for, and when I'll need it.
My mix: for example, "70% global stock index funds, 30% high-quality bonds."
My contributions: how much, how often, and when (automatic).
My limits: no leverage, no options, no single stock above 5%, speculation capped at 5%.
My crash rules: "If the market falls 20%, I do nothing except keep contributing. If it falls 30%, I rebalance back to my target mix. I don't sell because of headlines."
My review date: once or twice a year, on fixed dates.
Sign it. Date it. If you have a partner, have them sign it too. When the next panic hits, you won't be deciding. You'll be following your rules, written by the calm version of you.
Month 10: Rebalance on a schedule, not on a feeling
Once or twice a year, or whenever your mix drifts more than about 5 percentage points from your target, sell a little of what went up and buy a little of what went down to get back on target. It's the only "buy low, sell high" system most people will ever actually follow, because it's mechanical.
Month 11: Stress-test your plan before the market does
Hartford Funds estimates that over a 50-year investing life, you can expect to live through about 14 bear markets. You will see another one. Plan for it now:
Is your emergency fund still full?
Is money you need within 3–5 years out of stocks?
Could you keep contributing if your income dropped?
Does your partner know the plan, and where the accounts are?
Month 12: Measure the right things
At the 12-month mark, your balance may or may not be back to where it was. That depends partly on markets you can't control. So judge the year by what you can control:
✔ Zero leverage and zero panic trades.
✔ Emergency fund built.
✔ Twelve months of automatic contributions made.
✔ A diversified, low-cost core that makes up the vast majority of your money.
✔ A signed investment policy you actually follow.
If you can tick all five, you didn't just rebuild a portfolio. You rebuilt the investor. That is the part that compounds for the rest of your life.
"What If the Market Crashes Again in the Middle of My Plan?"
It might. That's not a flaw in the plan. It's what the plan is designed for.
If prices fall while you're contributing every month, your money buys more shares at lower prices. When the recovery comes, and historically recoveries have always come for the broad market, though on their own schedule, those extra shares do the heavy lifting. A crash during the rebuild phase is painful to watch but often helpful to a disciplined buyer.
What a second crash is dangerous for is a portfolio that's concentrated, leveraged, or holding money you need soon. That's exactly why Phases 1 and 2 come first.
Your 12-Month Checklist
Save this. Print it. Tick it off.
Month 1: 30-day trading freeze. Delete the app from your home screen. Full inventory of every holding. Tell your partner.
Month 2: $2,000 emergency floor reached. Margin and leverage on a path to zero. Close options and leveraged products. Attack high-interest debt.
Month 3: Sort every loss into Market, Concentration, Leverage or Speculation. Run the fresh-cash test on every individual position.
Month 4: One hour with a tax professional. Start your Mistakes Ledger.
Month 5: Choose your core index funds and your stock/bond mix.
Month 6: Put cash back to work, either all at once or on a pre-scheduled 3–6 month plan.
Month 7: Set up automatic monthly contributions and dividend reinvestment.
Month 8: Cap individual stocks at 5% each and speculation at 5% total. Sell or trim the rest.
Month 9: Write and sign your one-page Investment Policy.
Month 10: First scheduled rebalance.
Month 11: Stress-test: emergency fund, near-term money, income backup, partner briefing.
Month 12: Review the year against your five behavior goals. Set next year's contribution target.
Frequently Asked Questions
How long does it take to recover from a 50% portfolio loss?
It depends on what you own, what you add, and what the market does. A diversified portfolio that has to double on its own at around 7% a year would take about 10 years. Adding regular contributions can dramatically shorten the time it takes for your balance to get back to where it was. In our hypothetical example, $1,000 a month cut it to about three years. Concentrated stocks may never recover at all.
Should I sell everything and wait for the market to settle?
History says that's usually the most expensive choice. MIT researchers found nearly 31% of panic-sellers never returned to risky assets, and missing just the 10 best days over 20 years cut returns by more than half in Franklin Templeton's data. Sell only for a reason that would still make sense if prices were flat, such as removing leverage, failing the fresh-cash test, or needing the money within a few years.
Should I take more risk to recover my losses faster?
No. That's the single most common way a 50% loss becomes an 80% loss. Recover with time, steady contributions, and a diversified low-cost core, not with leverage, options, or concentrated bets.
Is dollar-cost averaging better after a big loss?
On pure averages, investing a lump sum has beaten cost averaging about two-thirds of the time in Vanguard's research. But for someone who's just been burned, a pre-scheduled 3–6 month plan is a sensible way to get invested without freezing, and it beat holding cash most of the time too.
Should I "average down" on the stock that crashed?
Only if it passes the fresh-cash test and the new total stays within your position limit (for example, 5% of your portfolio). Averaging down to "get back to even faster" is the sunk-cost trap in disguise.
The Bottom Line: You Don't Need a Miracle. You Need a Method.
A 50% loss is one of the most painful things that can happen to a person who has worked hard and saved. I won't pretend otherwise. The fear is real, the regret is real, and the math is real.
But here's what's also real. The investors who recover are almost never the ones who found a brilliant trade. They're the ones who stopped digging, protected their household, figured out honestly what went wrong, and then did something boring, over and over, for years: added money every month to a diversified, low-cost portfolio, and left it alone.
You can't control the next twelve months of the market. You can completely control the next twelve months of your behavior. Start with Month 1 today. Freeze the trading, take the inventory, build the cushion.
A year from now, you'll be a different investor. Quite possibly, a far better one than the person who opened that app at night and felt their stomach drop.
Keep reading
Sources
DALBAR, 2025 QAIB press release (2024 investor return gap)
Capital Group, summary of DALBAR's 2025 study (20-year growth of $100,000, 2005–2024)
Morningstar, Mind the Gap 2025: The more investors traded, the less their average dollar made
Tversky, A. & Kahneman, D. (1992), "Advances in Prospect Theory," Journal of Risk and Uncertainty; Brown et al. (2024), Meta-analysis of empirical estimates of loss aversion, Journal of Economic Literature
Elkind, Kaminski, Lo, Siah & Wong (2021), When Do Investors Freak Out? Machine Learning Predictions of Panic Selling, MIT
Barber, B. & Odean, T. (2000), Trading Is Hazardous to Your Wealth, Journal of Finance
Bessembinder, H. (2018), Do Stocks Outperform Treasury Bills?, Journal of Financial Economics
J.P. Morgan, The Agony & the Ecstasy: catastrophic stock declines
S&P Dow Jones Indices, SPIVA U.S. Year-End 2025
Hartford Funds, 10 Things You Should Know About Bear Markets
Franklin Templeton, The cost of timing the market (S&P 500, 2005–2024)
J.P. Morgan Asset Management, Guide to Retirement
Vanguard (2023), Cost averaging: Invest now or temporarily hold your cash?
Charles Schwab, Does Market Timing Work?
Vanguard emergency savings research (2025), as reported by CNBC/NBC
Nasdaq Composite record close, April 23, 2015, Fortune/Reuters
Disclaimer: This article is for general education only and is not personalized financial, tax or legal advice. Investing involves risk, including the loss of principal. Past performance does not guarantee future results. The hypothetical examples are illustrations, not predictions. Consider speaking with a licensed, fee-only financial adviser and a tax professional about your own situation.


Comments