What $500 a Month in an S&P 500 Index Fund Becomes After 10, 20 and 30 Years


On August 13, 1979, BusinessWeek ran a cover story that a whole generation of savers took to heart. The headline: "The Death of Equities."
The argument sounded airtight. Inflation was raging. Interest rates were climbing toward the sky. The magazine argued that millions of ordinary investors had already walked away from stocks and were unlikely to come back. The S&P 500 sat at about 107.
Now picture two neighbors reading that cover over breakfast.
The first one believes it. He keeps his savings "safe" in short-term U.S. Treasury bills, the textbook definition of cash, and adds $500 every month from January 1980 onward.
The second one shrugs, ignores the headline, and quietly puts the same $500 a month into a fund that simply owns the S&P 500. No stock tips. No market timing. No genius.
By the end of 2025, both had put in exactly $276,000. The cautious neighbor had about $568,000. The neighbor who ignored the magazine had about $8.2 million.

To be fair, $500 was real money in 1980, worth roughly $1,950 in today's dollars. But the lesson does not depend on the amount. It depends on what you believe "safe" really means, a trap I unpack in Why Your "Safe" Stocks Are Actually Costing You Thousands. And as I write this in October 2026, the same S&P 500 that BusinessWeek declared dead closed at 7,811 on October 9th, roughly 73 times its 1979 level, before counting a single dividend.
So let's answer the question that brought you here, using real numbers instead of sales talk: what does $500 a month in an S&P 500 index fund actually become after 10, 20 and 30 years? You will see the hopeful projections, the actual results from the last 98 years, the worst cases nobody likes to show you, and the handful of mistakes that turn a fortune into a disappointment.
Key takeaways in 30 seconds The math: $500 a month at 10% a year (close to the S&P 500's long-run average) grows to about $101,000 in 10 years, $362,000 in 20 years and $1.04 million in 30 years. The real history: $500 a month from 1996 to 2025 grew to $1,148,561, even with two brutal crashes along the way. The worst case: In every 30-year stretch since 1928, $500 a month never ended below $773,000. You put in $180,000. The big danger is you: Panic selling, chasing hot tips and high fees do far more damage than any crash. The best day to start: History says it is the earliest one you can manage. At 10% a year, each year of waiting can cost you around $100,000 at the finish line. |
Inside this article:
The Short Answer: What $500 a Month Becomes in 10, 20 and 30 Years
The Real Ride: 30 Years That Tested Every Nerve (1996 to 2025)
The Worst Possible Timing: What If You Started in January 2000?
The Hidden Gap: Why Most Investors Earn Less Than Their Own Funds
The 50-Year Proof: From "Bogle's Folly" to a $1.6 Trillion Fund
The Short Answer: What $500 a Month Becomes in 10, 20 and 30 Years
Here is the whole story in one table. The first column is what comes out of your pocket. The next two are simple projections at a cautious 7% a year and at 10% a year. The last column is what actually happened to someone who invested $500 a month over the most recent 10, 20 and 30 calendar years, ending December 31, 2025.
Time invested | You put in | At 7% a year | At 10% a year | Actual S&P 500 history |
|---|---|---|---|---|
10 years | $60,000 | $86,009 | $100,729 | $133,461 (2016 to 2025) |
20 years | $120,000 | $255,203 | $361,993 | $529,966 (2006 to 2025) |
30 years | $180,000 | $588,032 | $1,039,646 | $1,148,561 (1996 to 2025) |

Read that last row again slowly. Over 30 years you hand over $180,000, which is $500 a month, about what many families spend on eating out. The market hands back more than a million.
Notice something else. The money does not grow in a straight line. After 10 years you have roughly 1.7 times what you put in. After 20 years, about 3 times. After 30 years, nearly 6 times. That curve is compounding, and it is the single most important idea in this entire article.
How I Ran These Numbers (So You Can Trust Them)
Too many articles on this topic plug a rosy 12% into a calculator and call it a day. I want you to be able to check my work.
For the projections, I assumed $500 is invested at the start of every month and grows at a steady 7% or 10% a year, compounded monthly, with no fees and no taxes.
Why 10%? According to the historical data published by Professor Aswath Damodaran at NYU's Stern School of Business, $100 invested in the S&P 500 at the start of 1928, with dividends reinvested, would have grown to about $1,157,599 by the end of 2025. That works out to roughly 10% a year for 98 years, through the Great Depression, a world war, oil shocks, the dot-com crash, the 2008 financial crisis and a pandemic.
Why also show 7%? Because the future owes us nothing, and a plan that only works at 10% is a fragile plan. Inflation has averaged about 3% a year since 1928, according to Federal Reserve Bank of Minneapolis figures, so 7% is also a good rough guide to what your money does after inflation.
For the history columns, I used Damodaran's actual year-by-year S&P 500 total returns, dividends included, and spread each year's return evenly across its 12 months. Real life is lumpier than that, and real funds charge small fees, so treat every number here as a close estimate, not a bank statement.
Veteran's note Don't fall in love with the 10% figure. Fall in love with the habit. The investors who did best over these decades were not the ones who guessed the right return. They were the ones who kept buying every month when the news was terrible. |
Years 1 to 10: The Boring Decade Where Most People Quit
Let me be honest about the first decade, because this is where most investors give up.
After 10 years of $500 a month, the projections say you will have somewhere between about $86,000 and $101,000. You put in $60,000. The market added somewhere between $26,000 and $41,000.
That is good. But it does not feel life-changing. In the first few years, your own deposits do almost all of the work, and a single bad year can wipe out every cent of growth.

Look at the chart above. After 10 years, 60% of your balance is money you deposited yourself. After 30 years, it flips completely. Only 17% is your money, and 83% is growth the market created for you.
Charlie Munger, Warren Buffett's longtime partner, is widely quoted as saying the first $100,000 is brutally hard to build, but you have to do it. Ten years of $500 a month gets you right to that doorstep.
The actual results for the most recent decade were better than the projections. Someone who started in January 2016 had $133,461 by the end of 2025, because that decade happened to be an unusually strong one for the S&P 500, which returned roughly 14.7% a year.
But I promised you the worst cases too. The worst 10-year window in the entire record ran from January 1999 through December 2008. It began near the top of the dot-com bubble and ended in the depths of the financial crisis. After 10 years of faithful $500 deposits, that investor had $49,525. They had put in $60,000.
Here is the part most people never hear. Out of 89 overlapping 10-year periods since 1928, only 2 ended with less money than was put in: the one starting in 1965 and the one starting in 1999. In the typical 10-year period, $60,000 of deposits grew to about $108,000.
What this means for you Ten years is the minimum, not the goal. Over a single decade, the stock market can still disappoint you. Over two or three decades, history has been far kinder. If you might need this money within 5 to 10 years, it probably does not belong entirely in stocks. |
Years 11 to 20: When the Snowball Starts Rolling
Something changes in the second decade. Your balance becomes large enough that a normal year of growth starts to rival, then overtake, everything you deposit.
At 7% a year, $500 a month becomes about $255,000 after 20 years. At 10%, it becomes about $362,000. You put in $120,000.
The actual history is even more striking, because the last 20 years included one of the worst crashes since the Great Depression. Someone who started in January 2006 watched their account collapse in 2008. And yet by the end of 2025, after 20 years of $500 a month, they had $529,966.
Now zoom out to every 20-year period in the data, all 79 of them since 1928:
Not one ended with less than the $120,000 put in.
The worst one, starting in 1955 and running through the inflation-ravaged 1970s, still ended at $181,613.
The typical one ended at about $415,661.
The best one, starting in 1980, ended at $994,268.
In 87% of them, the investor at least doubled their money.
J.P. Morgan Asset Management's Guide to the Markets tells the same story from a different angle. Looking at calendar years from 1950 to 2025, the S&P 500 has swung from a 37% loss to a 52% gain in a single year. But across every rolling 20-year period, the worst result was still a gain of about 6% a year. There has never been a negative 20-year period in that data.
Smart move Time turns a coin flip into near-certainty. One year in the stock market is a gamble. Twenty years has, so far, been the closest thing to a sure bet that ordinary investors have ever had. Plan your investing in decades, not in months. |
Years 21 to 30: The Decade That Makes You Wealthy
This is where the magic happens, and it is why patient investors end up looking like geniuses.
At 7%, $500 a month for 30 years becomes about $588,000. At 10%, it becomes about $1,039,646. You put in $180,000.
In the projection at 10%, your balance grows by about $678,000 in the last 10 years alone. That is nearly four times everything you deposited over the entire 30 years. You are no longer the engine of your wealth. The market is.
The actual history delivered. Someone who invested $500 a month from January 1996 through December 2025 ended with $1,148,561. About 84% of it was growth.
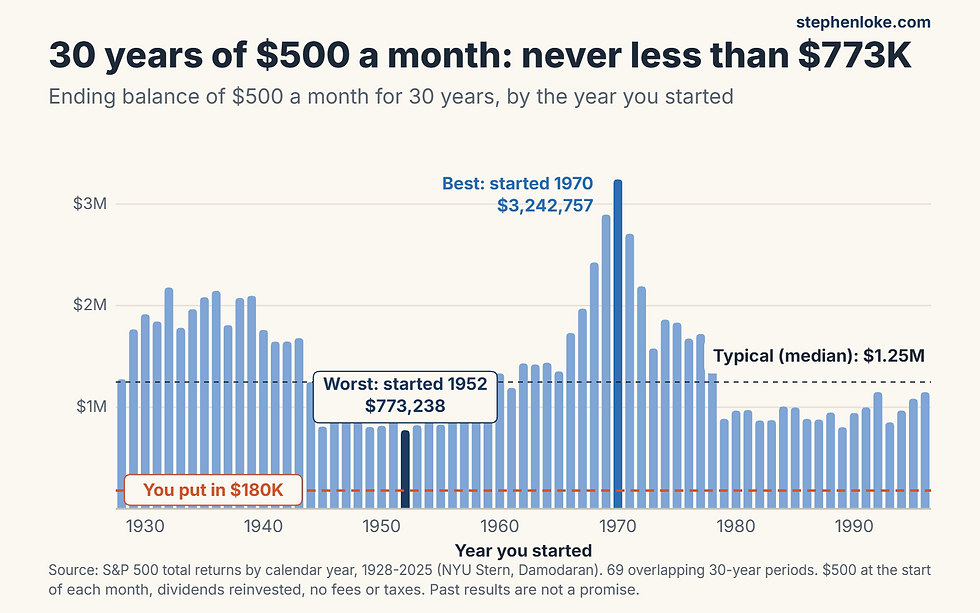
That chart is the most important picture in this article. Each bar is a different 30-year investor, from the person who started in 1928 to the person who started in 1996. The worst result, for someone who started in 1952 and ended in the gloomy markets of 1981, was $773,238. The best, starting in 1970, was $3,242,757. The typical result was about $1.25 million.
Not one of the 69 investors came anywhere close to losing money. The worst of them ended with more than four times what they put in.
Holding period | Worst result | Typical (median) result | Best result |
|---|---|---|---|
10 years ($60,000 in) | $49,525 (started 1999) | $108,285 | $189,834 (started 1946) |
20 years ($120,000 in) | $181,613 (started 1955) | $415,661 | $994,268 (started 1980) |
30 years ($180,000 in) | $773,238 (started 1952) | $1,247,268 | $3,242,757 (started 1970) |
Warren Buffett has made the same point many times. In his 2018 letter to shareholders, he recalled buying his very first stock on March 11, 1942, for $114.75. He calculated that if that money had simply gone into a no-fee S&P 500 index fund with dividends reinvested, it would have been worth $606,811 by January 31, 2019. That is a gain of 5,288 to 1, from an 11-year-old's pocket money.
If you want to see how this compares with trying to pick winning stocks yourself, read my breakdown of Stock Picking vs. the S&P 500: What 20 Years of Results Say About Who Actually Wins.
The Real Ride: 30 Years That Tested Every Nerve (1996 to 2025)
Averages hide pain. So let me walk you through what the $1.15 million journey actually felt like, year by year, for the investor who started in January 1996.

1996 to 1999: The easy years. The dot-com boom made everyone feel clever. After four years, $24,000 of deposits had grown to almost $40,000.
2000 to 2002: The first test. The bubble burst. The S&P 500 fell three years in a row. By the end of 2002, after seven years of faithful saving, the account was worth $38,432. The investor had put in $42,000. Seven years of discipline, and they were underwater.
2003 to 2007: Relief. Markets recovered. By the end of 2007, the account was worth about $108,000.
2008: The second test, and the cruelest. The global financial crisis hit. In a single year, the account fell by about $35,000, more than five years' worth of contributions, wiped out in twelve months. At the end of 2008, the balance was $73,401. The investor had put in $78,000. Thirteen years of saving, and once again they were behind.
This is the exact moment most people quit. The headlines were terrifying. Banks were failing. Friends were selling. It felt irresponsible to keep buying.
2009 to 2025: The reward. The investor who kept sending $500 a month into the storm bought shares at fire-sale prices. Seventeen years later, after the COVID crash of 2020 and the bear market of 2022, the account stood at $1,148,561.
Think about that. The person who quit at the end of 2008 walked away with about $73,000. The person who kept going ended up with more than $1.1 million. Same market. Same fund. One decision.
If you are living through a sharp drop right now, my guide The Market Just Dropped 20%. Here's What Calm Investors Do Next walks you through it step by step. And if your own portfolio is still deep underwater, How Long Does It Take to Recover From a 50% Stock Market Loss? shows you the math nobody else does.
The Worst Possible Timing: What If You Started in January 2000?
People often ask me, "But what if I start right before a crash?"
So let's take the worst start in modern history. January 2000 was the peak of the dot-com bubble. What followed became known as the "lost decade." From 2000 through 2009, the S&P 500 returned about negative 0.95% a year, dividends included, according to research from Dimensional Fund Advisors and reporting by The Wall Street Journal's Jason Zweig.
A lump sum invested in January 2000 lost money for a full decade. But a monthly investor did something remarkable.
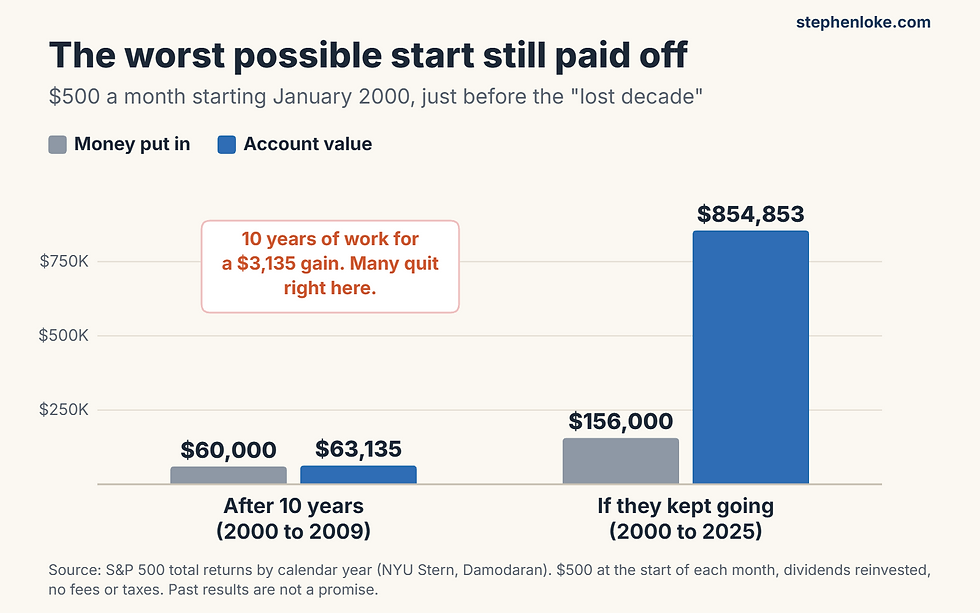
After 10 years of $500 a month, the January 2000 investor had $63,135 against $60,000 put in. Ten years of effort for a gain of $3,135. Many people looked at that number and concluded the stock market was rigged.
The ones who kept going told a different story. By the end of 2025, that same investor, who had started at the worst possible moment, had put in $156,000 and owned $854,853.
How does that work? Because buying every month, through good times and bad, quietly turns falling prices into an advantage. It is called dollar-cost averaging, and here is the simplest way I know to explain it.

When the price drops from $100 to $50, your $500 buys 10 shares instead of 5. You are collecting more of the same companies at half price. When prices recover, all those cheap shares go up with them. In this four-month example, the price ends exactly where it started, yet your $2,000 has become $2,625.
Even the investor who started in January 2008, right before the financial crisis, was fine. After 10 years they had $122,142 against $60,000 put in. By the end of 2025, they had $445,308 from $108,000 of deposits.
What this means for you For a monthly investor, a crash in the early years is not a disaster. It is a sale. The real danger is not bad timing. It is stopping. |
The Hidden Gap: Why Most Investors Earn Less Than Their Own Funds
Here is an uncomfortable truth. The S&P 500 does not make most investors rich. The way most investors behave with the S&P 500 keeps them from getting rich.
Morningstar studies this every year in a report called "Mind the Gap." Its 2026 edition found that over the 10 years to the end of 2025, U.S. fund investors earned about 8.7% a year, while the funds they owned returned about 9.9% a year. That 1.2 percentage point gap comes from buying after prices rise and selling after they fall.
The research firm DALBAR found the gap can be enormous in a single year. In 2024, the average stock fund investor earned 16.54%, while the S&P 500 returned 25.02%, a gap of 8.48 percentage points. In 2025, investors behaved much better, and the gap shrank to just 0.72 points. Behavior, not the market, made the difference.
Why does jumping in and out hurt so much? Because the market's biggest gains arrive in a handful of days, and those days usually show up when things look the scariest.

According to J.P. Morgan's 2026 Guide to Retirement, $10,000 left in the S&P 500 from 2006 through 2025 grew to $80,619. Missing just the 10 best days cut that to $35,866. Missing the 30 best days left only $13,826. And six of the 10 best days came within two weeks of the 10 worst days. If you sell in a panic, you almost always miss the rebound.
Charles Schwab ran an even simpler experiment. Five imaginary investors each received $2,000 at the start of every year from 2005 to 2024:
Investor | What they did | Ending value |
|---|---|---|
Peter Perfect | Invested at the exact lowest point of every year | About $186,000 |
Ashley Action | Invested on the first day of every year | $170,555 |
Matthew Monthly | Split it into 12 monthly amounts | $166,591 |
Rosie Rotten | Invested at the exact highest point of every year | $151,343 |
Larry Linger | Stayed in cash, waiting for the "right time" | $47,357 |
Perfect timing, which no human can do, beat simply investing right away by only about $15,500 over 20 years. Even the worst-timed investor on Earth, Rosie, beat the cash-hoarder by more than $100,000. Schwab found the same ranking in 70 of 80 rolling 20-year periods going back to 1926.
The lesson is clear. The decision that matters is not when you invest. It is whether you invest at all, and whether you stay invested. My article Why Smart People Lose Money in the Stock Market explains the mental traps that make staying put so hard.
The Silent Thief: The "Small" Fee That Eats a Fortune
You can do everything right, invest every month, never panic, and still lose a huge piece of your future to something that looks tiny on paper: the annual fee.
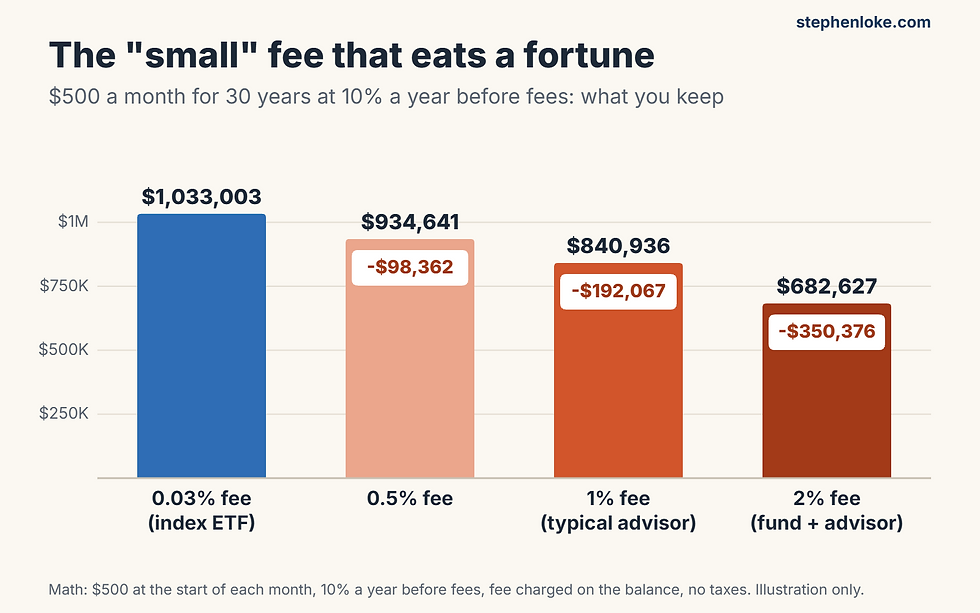
Look at what different annual fees do to the same $500 a month over 30 years, assuming 10% a year before fees:
With a 0.03% fee, the cost of a low-cost S&P 500 index ETF, you keep about $1,033,003.
With a 1% fee, a common charge for a financial advisor or an actively managed fund, you keep about $840,936. The fee quietly takes $192,067.
With 2%, an active fund plus an advisor, you keep about $682,627. More than a third of a million dollars, gone.
A 1% fee does not cost you 1%. Because it is charged every year on your growing balance, over 30 years it can eat close to a fifth of your final wealth. The U.S. Securities and Exchange Commission's investor education site, Investor.gov, makes the same point with its own example, showing that on a $100,000 investment over 20 years, a 1% fee leaves you nearly $30,000 worse off than a 0.25% fee.
Paying more does not buy better results either. According to the SPIVA U.S. Scorecard from S&P Dow Jones Indices, 92.9% of actively managed U.S. large-company stock funds trailed the S&P 500 over the 20 years ending in 2025. Over 15 years, it was 89.9%.
Warren Buffett, arguably the greatest stock picker alive, knows this better than anyone. In his 2013 letter to Berkshire Hathaway shareholders, he described the instructions he left for the money going to his wife after his death: put 10% in short-term government bonds and 90% in a very low-cost S&P 500 index fund. He even named Vanguard's as his suggestion.
Reality check If someone is selling you an investment that charges 1% to 2% a year, ask them one question in writing: "After your fees, did your recommendations beat a simple S&P 500 index fund over the last 15 years?" Most cannot say yes. |
The 50-Year Proof: From "Bogle's Folly" to a $1.6 Trillion Fund
Fifty years ago, on August 31, 1976, a man named Jack Bogle launched something Wall Street laughed at: a fund that did not try to beat the market. It simply bought all the stocks in the S&P 500 and held them.
Critics called it "Bogle's Folly." Bogle had hoped to raise as much as $150 million. The fund raised just $11.3 million, a result Bogle himself later described as an abject failure, according to Vanguard.
This August, that fund, now the Vanguard 500 Index Fund, turned 50. According to Vanguard's anniversary announcement, $10,000 invested at its launch would have grown to about $2.48 million by July 31, 2026. Its fee has fallen from 0.43% a year at launch to just 0.03% for its ETF shares. All its share classes together held about $1.675 trillion at mid-2026, and in June 2026 its ETF share class, VOO, passed $1 trillion in assets on its own, according to Morningstar.
The "folly" won so completely that, by the end of 2023, money in U.S. index funds overtook money in actively managed funds for the first time, according to Morningstar data reported by CNBC. Vanguard estimates that the shift to low-cost indexing has saved investors about $570 billion in fees since 2000.
When the laughingstock of 1976 becomes the way the world invests, it is worth paying attention.
Real People, Real Money: The Quiet Millionaires Next Door
Index investing does not make headlines because it is boring. But look closely, and you find ordinary people getting rich with it.
In September 2026, Fidelity Investments reported a record 769,000 401(k) retirement accounts worth $1 million or more on its platform, as covered by CBS News and Bloomberg. These are mostly not stock-picking geniuses. They are workers who saved a slice of every paycheck, year after year, into diversified funds.
USA TODAY told the story of one of them, Elisa Brown. She started as a Southwest Airlines flight attendant in 2000, at age 24, earning under $20,000 a year. She never earned more than $100,000. She contributed 8% of her pay, later 10%, collected her employer's match, invested in stock market index funds and never touched the money. In about 25 years, her account passed $1 million.

No hot tips. No day trading. No luck required. Just a paycheck, a percentage, an index fund and time.
If you have been tempted by faster ways to get rich, read Why Most Day Traders Lose Money, and the Boring Alternative That Quietly Wins before you risk a single dollar.
The Honest Fine Print: Inflation, and How to Beat It
I would be doing you a disservice if I let you walk away thinking $1 million in 30 years will feel like $1 million today. It will not.
At 3% inflation a year, prices roughly double every 24 years. So $1,039,646 in 30 years would buy roughly what $428,000 buys today. Still life-changing. But not the same.
There is a simple fix. Raise your monthly investment a little every year, in line with your income. If you increase your $500 by just 3% a year, so $515 a month in year two, $530 in year three and so on, your 30-year result at 10% grows to about $1,356,000, and you will have contributed about $285,000.
Smart move Set your raise on autopilot. Every time you get a pay increase, raise your monthly investment the same day, before you get used to spending it. Most fund platforms let you schedule automatic yearly increases. |
Waiting Is the Most Expensive Decision You Will Ever Make
Every reader of this article has the same enemy: tomorrow. "I'll start when the market calms down." "I'll start after the next bonus." "I'll start when I understand it better."
Here is what waiting costs, using the same $500 a month at 10% a year:
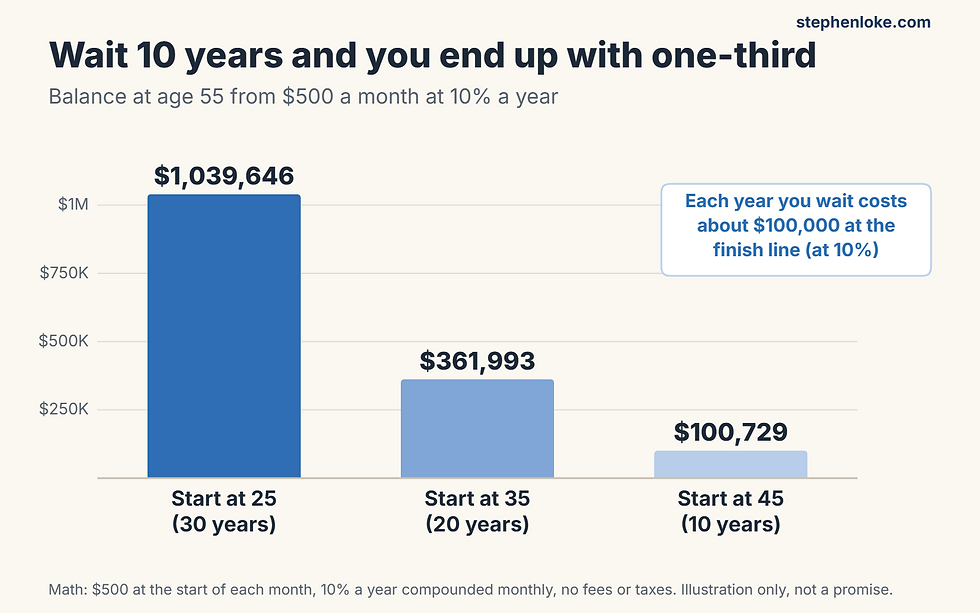
Start at 25 and you have about $1.04 million at 55. Start at 35 and you have about $362,000. Start at 45 and you have about $101,000. Waiting 10 years does not cost you a third of your money. It costs you two-thirds.
Even a single year matters. At 10% a year, investing for 29 years instead of 30 leaves you about $100,000 poorer at the finish line. At a cautious 7%, it still costs about $44,000. One year of hesitation can cost more than you will save in all the years that follow.
What if you are already 50 or older? Don't despair, and don't gamble to catch up. At 7% a year, $500 a month for 15 years grows to about $156,000, and $1,000 a month grows to about $313,000. Combined with your other savings, that can make a real difference to your retirement. My article You Lost Money in the Stock Market at 50. Is It Too Late to Retire Comfortably? lays out a realistic plan.
Investing From Outside the U.S.? Read This Before You Buy
Readers of this site come from all over the world, so let me share three things that most U.S.-focused articles never mention. Please confirm the details for your own country with a licensed tax adviser.
1. Dividend withholding tax. When a U.S. company pays a dividend to a non-U.S. investor, the U.S. normally withholds 30% unless a tax treaty lowers the rate. Neither Malaysia nor Singapore has an income tax treaty with the United States, according to the IRS treaty list, so investors there buying U.S.-listed funds like VOO typically lose 30% of their dividends.
2. U.S. estate tax. This is the big one. If a non-U.S. person dies holding U.S.-based assets, such as U.S.-listed ETFs, their estate may owe U.S. estate tax, and the IRS requires a return once those U.S. assets exceed just $60,000. For a family that has spent 30 years building a $1 million portfolio, that is a serious risk.
3. The common workaround. Many international investors use S&P 500 funds based in Ireland, known as UCITS ETFs, such as the iShares Core S&P 500 UCITS ETF (CSPX) or the Vanguard S&P 500 UCITS ETF (VUAA). Under the U.S.-Ireland tax treaty, these funds generally face 15% withholding on U.S. dividends instead of 30%, and they are generally not treated as U.S. assets for estate tax purposes. Their fees are slightly higher, at about 0.07% a year.
How much does the tax leak matter? With today's S&P 500 dividend yield of a little over 1%, 30% withholding costs you roughly 0.4% a year, and 15% costs roughly 0.2%. Applied to the 1996 to 2025 history, $500 a month would have ended at about $1.07 million with a 0.4% drag and about $1.11 million with a 0.2% drag, instead of $1.15 million. Real money, but nowhere near enough to stop you from investing.
Which S&P 500 Index Fund? A Simple Comparison
All of these funds track the same 500 companies. The main differences are cost, where the fund is based and how it handles dividends. This is not a recommendation. It is a starting point for your own research.
Fund (ticker) | Yearly fee | Good to know |
|---|---|---|
Vanguard S&P 500 ETF (VOO) | 0.03% | U.S.-listed. The ETF version of Bogle's original fund. |
iShares Core S&P 500 ETF (IVV) | 0.03% | U.S.-listed. Very large and liquid. |
State Street SPDR Portfolio S&P 500 ETF (SPYM) | 0.02% | U.S.-listed. Formerly known as SPLG. |
SPDR S&P 500 ETF Trust (SPY) | 0.0945% | U.S.-listed. The oldest S&P 500 ETF, popular with traders. |
Fidelity 500 Index Fund (FXAIX) | 0.015% | U.S. mutual fund, usually for U.S. retirement accounts. |
iShares Core S&P 500 UCITS ETF (CSPX) | 0.07% | Ireland-based, reinvests dividends. Popular outside the U.S. |
Vanguard S&P 500 UCITS ETF (VUAA) | 0.07% | Ireland-based, reinvests dividends. Popular outside the U.S. |
Fees as listed on issuer websites and fund filings in October 2026. Check the current figure before you invest.
Your $500-a-Month Plan in 7 Simple Steps
Knowing the numbers is worth nothing unless you act on them. Here is the plan I would give a member of my own family.
Build a safety cushion first. Keep three to six months of expenses in cash so that a job loss or a crash never forces you to sell.
Pick one low-cost S&P 500 index fund. Choose a fee under 0.1% a year that suits your country and your broker.
Automate it. Set up an automatic monthly purchase on payday, so the money is invested before you can spend it.
Reinvest every dividend. Choose an accumulating fund or switch on automatic dividend reinvestment.
Raise it every year. Increase your monthly amount with every pay rise, even by 3%.
Write a crash rule now. On paper, write: "When the market falls 20% or more, I will keep buying and I will not sell." Sign it. Read it when the headlines get loud.
Check once a year, not once a day. Review your plan every January. The rest of the year, let it work.
Paul Samuelson, the Nobel Prize-winning economist, is often credited with saying that investing should be like watching paint dry or grass grow, and that if you want excitement, you should take some money to Las Vegas. Make your investing boring. Make your life exciting.
And one more myth to retire: Albert Einstein almost certainly never called compound interest the eighth wonder of the world. Quote Investigator found no evidence that he said it, and Snopes traced the earliest link to Einstein to decades after his death. But the numbers in this article don't need a famous quote. They speak for themselves.
Frequently Asked Questions
How much will $500 a month be in 30 years in the S&P 500?
At 10% a year, close to the S&P 500's long-run average, $500 a month grows to about $1,039,646 in 30 years. At a cautious 7% a year, it grows to about $588,032. In real history, $500 a month from 1996 to 2025 grew to $1,148,561. You contribute $180,000 in total.
How much will $500 a month be worth in 10 and 20 years?
After 10 years, about $86,000 at 7% a year or $101,000 at 10%. After 20 years, about $255,000 at 7% or $362,000 at 10%. In history, the 10 years to 2025 produced $133,461 and the 20 years to 2025 produced $529,966.
Can you become a millionaire investing $500 a month?
Yes, historically, if you give it enough time. At 10% a year it takes about 30 years. At 7% it takes about 37 years. Raising your contribution by 3% a year shortens the journey.
What is the average annual return of the S&P 500?
Including dividends, the S&P 500 has returned roughly 10% a year since 1928, based on data from NYU Stern's Aswath Damodaran. After about 3% average inflation, that is roughly 7% a year in real terms. Individual years vary wildly, from big losses to big gains.
What happens if the market crashes right after I start?
For a monthly investor, an early crash usually helps, because your fixed $500 buys more shares at lower prices. Someone who started in January 2000, just before the lost decade, still turned $156,000 of deposits into $854,853 by the end of 2025.
Is it better to invest $500 a month or a lump sum?
If you already have a lump sum, research such as Charles Schwab's timing study suggests investing it sooner usually beats waiting. If you are investing from your paycheck, $500 a month is the natural way to build wealth, and it removes the stress of timing.
Which S&P 500 index fund is best?
The best fund is usually the cheapest one that suits your country and account. U.S. options such as VOO, IVV and SPYM charge 0.02% to 0.03% a year. Investors outside the U.S. often look at Ireland-based UCITS funds such as CSPX or VUAA because of withholding and estate tax rules.
Can people outside the United States invest in the S&P 500?
Yes. Most international brokers offer U.S.-listed and Ireland-based S&P 500 funds. Non-U.S. investors should check dividend withholding tax and U.S. estate tax rules, and speak with a licensed tax adviser in their own country.
The Bottom Line
Back in 1979, a respected magazine told a generation of savers that the stock market was finished. The people who believed it stayed "safe" and stayed small. The people who ignored the noise and kept investing a modest amount every month built real wealth.
The numbers in this article come down to three simple truths:
$500 a month is enough. History shows it can grow to roughly $100,000 in 10 years, several hundred thousand in 20, and around a million in 30.
Time beats timing. Since 1928, no 20-year period of $500 a month ended below what was put in, and no 30-year period ended below $773,000.
Your behavior and your fees decide the rest. Stay invested through the scary years, keep costs tiny, and let compounding do the heavy lifting.
You cannot control what the market does next year. You can control whether you start this month.
FREE REPORT: Why You Lost Money in the Stock Market (And Why It Wasn't Your Fault) You have just seen what $500 a month can become when you stay the course. My free 38-page report shows you what usually stops people from getting there. It reveals the 7 Wall Street traps that quietly drain ordinary investors, the "small" yearly fee that can swallow a fortune, what Warren Buffett told his own family to do with their inheritance, and the one boring strategy the industry hopes you never discover. Written in plain English for investors over 40 who have lost money and want a calm, proven way to rebuild wealth for retirement. 100% free. Instant download. No credit card. |
Important: This article is for education only and is not personal financial, investment or tax advice. Past performance does not guarantee future results. Projections assume steady returns with no fees or taxes, and historical figures are estimates based on calendar-year index data. Index funds can and do lose value. Please consider your own situation and speak with a licensed adviser before investing.
Sources
Associated Press via La Nacion: How major U.S. stock indexes fared, 9 October 2026
Aswath Damodaran, NYU Stern: Historical returns on stocks, bonds and bills, 1928 to 2025
Federal Reserve Bank of Minneapolis: Consumer Price Index, 1913 to present
S&P Dow Jones Indices: U.S. Equities Market Attributes, 2025 total return
J.P. Morgan Asset Management: Guide to the Markets, U.S., 4Q 2026 (PDF)
J.P. Morgan Asset Management: Guide to Retirement 2026 (PDF)
Warren Buffett: 2018 Letter to Berkshire Hathaway Shareholders (PDF)
Warren Buffett: 2013 Letter to Berkshire Hathaway Shareholders (PDF)
Jason Zweig, The Wall Street Journal: the lost decade (reposted)
Investor.gov (SEC): How Fees and Expenses Affect Your Investment Portfolio
S&P Dow Jones Indices: SPIVA U.S. Scorecard Year-End 2025 (PDF)
Vanguard: 50th anniversary of the Vanguard 500 Index Fund press release
Vanguard 500 Index Fund semi-annual report, 30 June 2026 (SEC filing)
Morningstar: Vanguard S&P 500 ETF breaks the trillion-dollar barrier
Bloomberg: America's population of 401(k) millionaires keeps growing
USA TODAY: Here's how 6 Americans became 401(k) millionaires
IRS: Some nonresidents with U.S. assets must file estate tax returns
IRS: Withholding on U.S.-source income paid to nonresident aliens
Vanguard: S&P 500 UCITS ETF (USD) Accumulating factsheet (PDF)
Snopes: Did Einstein call compound interest the most powerful force in the universe?
Quote Investigator: Compound interest is the eighth wonder of the world



Comments