Lump Sum or Monthly? How to Put Money Back Into the Market After a Big Loss


Picture a retired accountant in St. Louis named Cheryl Friedman.
In the fall of 2008, as the stock market caved in, Cheryl and her husband did what millions of frightened people did. They pulled most of their money out of stocks and parked it somewhere "safe": a money-market account. By 2012 it was earning about 0.1% a year.
Then the market turned. By March 2012, the S&P 500 had roughly doubled from its 2009 bottom. And Cheryl's money? Still sitting there. When an Associated Press reporter asked her about it, she said something that may sound painfully familiar:
"I have a whole lot of money sitting on the sidelines, because I'm afraid."
If you have lost real money in the stock market, you probably know exactly how Cheryl felt. Maybe you sold near the bottom. Maybe you are holding cash from a matured deposit, a bonus, an inheritance, or what is left of a trading account. And now one question keeps circling in your head at 2 a.m.:
Do I put it all back in at once, or a little bit each month?
This is one of the most studied questions in personal finance. Vanguard has studied it. Charles Schwab has studied it. So have Northwestern Mutual, Fidelity, and researchers at MIT. The honest answer is more interesting, and far more useful, than the one-line answers you will find elsewhere.
By the end of this article you will know what nearly a century of data says, why your brain quietly works against you after a loss, what happened to real people who chose each path, and the exact plan I would use to put money back to work without losing sleep. Let's begin.
The 60-second answer (if you read nothing else) ✔ Lump sum usually wins. In Vanguard's research, investing everything at once beat spreading it out about 2 out of 3 times. ✔ But the gap is small. In Vanguard's 2023 study, the typical edge was only about 2% after one year. ✔ Waiting in cash is the real disaster. In Schwab's 20-year study, the investor who sat in cash ended with $123,000 less than the one who invested right away. ✔ After a big loss, the best plan is the one you will actually stick to. For most burned investors, that means a written, automatic plan: all in now, or equal amounts over 3 to 12 months. Never "when things calm down." |
What you'll learn in this guide:
Lump Sum vs. Monthly: What the Words Actually Mean
Lump-sum investing means putting the whole amount into the market on day one. Dollar-cost averaging, which most people simply call "investing monthly," means splitting the same amount into equal parts and investing one part at a time on a fixed schedule. For example, $60,000 invested as $10,000 a month for six months.
One quick clarification saves a lot of confusion. Investing part of every paycheck is not really a lump-sum question. That money does not exist yet, so investing it the moment it arrives is simply the right thing to do. (If that is your situation, read What $500 a Month in an S&P 500 Index Fund Becomes After 10, 20 and 30 Years.)
The real dilemma only appears when you have a pile of cash sitting in front of you today. And there is a third option that almost nobody admits they are choosing: waiting. Waiting for the market to "settle down." Waiting for one more dip. Waiting until it feels safe. Keep that third option in mind, because the data on it is the most shocking part of this whole story.
Round One: What Nearly a Century of Data Says
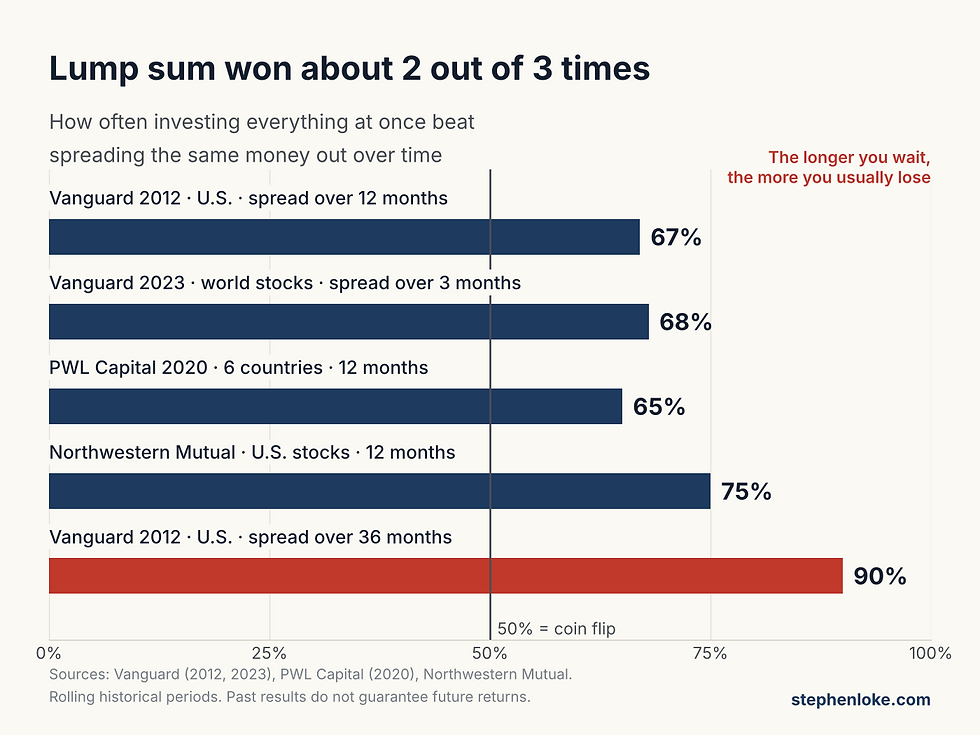
In July 2012, three Vanguard researchers, Anatoly Shtekhman, Christos Tasopoulos and Brian Wimmer, ran a simple but powerful test. They imagined an investor with $1 million and a balanced portfolio of 60% stocks and 40% bonds. In one version, the investor put it all in at once. In the other, the investor spread it evenly over 12 months. Then they repeated the test across every rolling 10-year period they could find.
The results were remarkably consistent across three countries:
United States (1926–2011): lump sum won 67% of the time
United Kingdom (1976–2011): lump sum won 67% of the time
Australia (1984–2011): lump sum won 66% of the time
In the U.S., the lump-sum investor finished with an average of about 2.3% more money. On $1 million, that was $2,450,264 versus $2,395,824 after ten years.
Other firms keep finding the same pattern. Northwestern Mutual ran its own version and found that lump sum beat a 12-month spread 75% of the time for an all-stock portfolio, 80% for a 60/40 mix and 90% for an all-bond portfolio. Ben Felix of PWL Capital tested six countries in 2020 and found lump sum won about 65% of the time on average.
Vanguard updated its research in February 2023. Megan Finlay and Josef Zorn looked at global stocks from 1976 to 2022 and found lump sum beat a three-month spread 68% of the time. Stretch that spread to six months in the U.S. and lump sum's win rate jumped from 66.4% to 73.7%.
Why does lump sum keep winning? Because markets rise far more often than they fall. Of the 98 calendar years from 1928 to 2025, the S&P 500 finished 72 of them in positive territory, roughly three years out of four. J.P. Morgan's latest Guide to the Markets shows the same pattern: despite an average drop of 14.2% at some point during each year, annual returns were positive in 35 of the last 46 years.
So every month your money waits in cash, you are quietly betting that this will be one of the unlucky months. The odds are against you. And the longer you stretch the spread, the worse those odds get. When Vanguard tested a 36-month spread, lump sum won about 90% of the time.
Key insight Spreading your money out is not a way to earn more. It is a way to feel safer, and it has a price. Vanguard's original paper put it bluntly in its title: dollar-cost averaging "just means taking risk later." |
Round Two: The Part the Spreadsheets Leave Out
If the story ended there, this would be a very short article. But averages hide something important: what happens in the bad years.
That same 2012 Vanguard study also measured the pain. Over 1,021 rolling 12-month periods in the U.S., the lump-sum investor was down after the first year 22.4% of the time. The monthly investor was down only 17.6% of the time. And when losses did happen, they were smaller. The average first-year loss on $1 million was $84,001 for the lump sum versus $56,947 for the monthly investor.

The 2023 update found the same thing. In the worst 5% of outcomes for a $100,000 all-stock investment, the lump sum fell to about $82,947 after a year, while cost averaging held at about $85,906. Northwestern Mutual's study made the same point in plain language: spreading money out won mainly when markets were trending lower.
So here is the real trade-off:
Lump sum: more money on average, but bigger and more frequent bruises in the short run.
Monthly: slightly less money on average, but a smoother, gentler ride.
Which matters more? That depends on one thing: what you will do when the bruise arrives. For someone who has never lost money, that is a theoretical question. For you, after a big loss, it is not theoretical at all.
Meir Statman, a finance professor at Santa Clara University, has written about this for three decades. His 1995 paper in the Journal of Portfolio Management explained why so many people prefer dollar-cost averaging even though it earns less on average: it protects us from regret and helps with self-control. In 2018 he summed it up with a title I love: Dollar-Cost Averaging Is Not Rational, but It Is Normal and Can Be Wise.
Why Your Brain Isn't Neutral After a Big Loss
Here is something most financial articles never tell you. The person reading this after a big loss is not making the same decision as someone with fresh money and no scars. Your brain has been changed by the loss, and it is pulling you in two dangerous directions at once.
First, losses simply hurt more. In their famous 1992 research on prospect theory, Amos Tversky and Nobel laureate Daniel Kahneman measured that the median person feels a loss about 2.25 times as strongly as a gain of the same size. Losing $10,000 hurts more than twice as much as winning $10,000 feels good.
Second, a loss creates two opposite traps.
The first is the break-even trap. In 1990, Richard Thaler (another future Nobel winner) and Eric Johnson ran experiments with real money and found that after a loss, people become strongly attracted to bets that offer a chance to "get even." That is the psychology behind The Revenge Trade: How a $50K Loss Quietly Becomes $200K. The investor pours money back in all at once, often into the same risky stock, hoping for a fast recovery.
The second is the snake-bite trap, a name popularized by finance professor John Nofsinger. Once bitten, you recoil from anything that looks like a snake. The investor who got hurt hides in cash, waiting for a sense of safety that never comes. That is exactly what happened to Cheryl.

The snake-bite trap can last a lifetime. Economists Ulrike Malmendier and Stefan Nagel showed in a 2011 study, nicknamed "Depression Babies," that people who live through poor stock returns invest less in stocks for decades afterward. A painful market experience can quietly shape your money decisions for many years, long after the market itself has recovered.
And researchers at MIT measured how often fear turns into a permanent exit. Daniel Elkind, Andrew Lo and colleagues studied 653,455 brokerage accounts from 298,556 households between 2003 and 2015. They found that 30.9% of the investors who panic sold had still not returned to risky assets by the end of the study. The median panic seller earned a zero to negative return afterward. Most surprising of all, investors who rated their own experience as "excellent" were about twice as likely to panic sell during a crisis.
If any of this sounds like you, you are in good company. I explain the full set of mental traps in Why Smart People Lose Money in the Stock Market: 8 Mental Traps and How to Escape Them.
Veteran's note After a big loss, the most useful question is not "lump sum or monthly?" It is "which trap am I more likely to fall into?" If you tend to chase losses, the discipline of a monthly schedule protects you. If you tend to freeze, a firm start date protects you. Either way, the cure is the same: decide on paper, before emotions get a vote. |
The Most Expensive Choice: Waiting for the "Right Time"
Now let's look at that third option, the one nobody admits they are choosing.
The Schwab Center for Financial Research ran a beautifully simple study, most recently updated in July 2025. Five imaginary investors each received $2,000 a year for 20 years, from 2005 to 2024, and invested it in the S&P 500 in different ways:
Perfect timing: somehow invested at the lowest point of every single year
Invested right away: put the money in on the first trading day of each year (the lump-sum investor)
Invested monthly: split each $2,000 into 12 equal monthly amounts
Worst timing: invested at the highest point of every single year
Waited in cash: kept waiting for a better moment and stayed in Treasury bills
Here is what each one had after 20 years:

Read those numbers slowly. The monthly investor finished only about $4,000 behind the lump-sum investor. Even the investor with the worst possible timing, buying at the peak every single year for two decades, ended with more than three times as much as the one who waited in cash. Schwab's own conclusion fits on a sticky note: "Procrastination can be worse than bad timing." And this was not a fluke of one period. Schwab found the same ranking in 70 of the 80 rolling 20-year periods going back to 1926.
Real people show the same pattern. In August 2011, Fidelity looked at 7.1 million 401(k) retirement accounts. About 117,000 people had sold every stock they owned between October 2008 and March 2009, near the bottom of the crash. Here is how their balances compared by June 2011:

Notice the second bar. The people who sold and later went back in gained 25%. That is far from perfect, but it is more than twelve times the gain of those who stayed out. Getting back in late still beat never getting back in at all.
Vanguard saw the same thing in the COVID crash. Fewer than 0.5% of its investors went fully to cash between February and May 2020, and more than 80% of those who did would have been better off if they had simply stayed the course.
And it is not just a crash problem. Morningstar's 2026 "Mind the Gap" study found that over the 10 years to the end of 2025, the average fund investor earned 8.7% a year while the funds themselves returned 9.9%. That 1.2-point gap, every single year, comes mostly from buying and selling at the wrong times. Over a working lifetime it can quietly cost hundreds of thousands of dollars.
The $4,000 mistake vs. the $120,000 mistake Choosing monthly instead of lump sum is a small mistake, if it is a mistake at all. Choosing to wait is a giant one. In Schwab's study, the gap between investing right away and investing monthly was about $4,000. The gap between investing right away and waiting was more than $120,000. Vanguard's 2023 paper reached the same verdict: cost averaging beat staying in cash 69% of the time. Stop agonizing over the small decision and make sure you never make the big one. |
Why the Best Days Hide Right Next to the Worst Days
"But I'll get back in once things calm down." I understand the instinct. The problem is that the market's biggest up days almost never arrive when things are calm.
J.P. Morgan's 2026 Guide to Retirement tracked $10,000 invested in the S&P 500 from January 2006 to December 2025. Stay invested the whole time and it grew to $80,619. Miss just the 10 best days in those 20 years, and it grew to only $35,866. Miss the 30 best days and you barely beat your starting money.

Here is the cruel twist: six of those 10 best days came within two weeks of the 10 worst days. Hartford Funds found that 78% of the market's best days over the last 20 years happened either during a bear market or in the first two months of a new bull market. In other words, the best days arrive exactly when you feel the most frightened.
We have seen this again and again in recent years:
COVID, 2020. The S&P 500 fell 33.9% between February 19 and March 23. By August 18 it was at a new record high, and it finished the year up about 18.4% including dividends.
The tariff shock, 2025. The index fell 18.9% from February 19 to April 8. The very next day, April 9, it jumped 9.5%, its biggest one-day gain since 2008. By June 27 it was at a new record.
The war scare, 2026. As conflict with Iran pushed oil above $100 a barrel, the S&P 500 slid about 9% by late March. By April 15 it was at a new all-time high.
Each time, the people waiting for calm missed the rebound. I walk through exactly what calm investors do during a fall in The Market Just Dropped 20%. Here's What Calm Investors Do Next.
Four True Stories From the Market's Darkest Days
Data is persuasive. Stories are memorable. Here are four real cases that show what lump sum, monthly investing and waiting look like in real life.
1. Warren Buffett's "too early" lump sum (2008)
On October 16, 2008, in the middle of the financial crisis, Warren Buffett published an opinion piece in The New York Times titled "Buy American. I Am." He revealed that his personal account, which had held nothing but U.S. government bonds, would soon be entirely in American stocks. He repeated his famous rule: "Be fearful when others are greedy, and be greedy when others are fearful."
Here is the part most people forget. Buffett was early. The S&P 500 closed at 946 the day his article appeared, then kept falling for nearly five more months, to a low of 676.53 on March 9, 2009. That is another 28% drop after the world's most famous investor said "buy."
Did it matter? Not in the long run. When the S&P 500 finally closed above its 2007 record on March 28, 2013, it was about 66% higher than on the day Buffett's article ran, before counting dividends. The lesson: even the greatest investor alive cannot pick the bottom. He did not need to. He needed to be in.
2. Cheryl and Harvey: two investors, one crash (2008–2012)
The same 2012 Associated Press story that featured Cheryl Friedman also profiled Harvey Bookman, a 60-year-old from Brooklyn. While Cheryl's money sat in a money-market account earning almost nothing, Harvey kept buying through the worst of the panic.
Same crash. Same headlines. Same fear. The only difference was what each of them did next. Three years later, one was still afraid and the other had taken full part in a market that had roughly doubled. That is the Fidelity chart above, told through two human beings.
3. Japan: the worst-case scenario for a lump sum (1989–2024)
If you want the strongest possible case for investing monthly, look at Japan. On December 29, 1989, the Nikkei 225 index peaked at 38,915.87. It did not close above that level again until February 22, 2024. That is 34 years. Someone who invested a lump sum at the peak spent more than three decades underwater.
Now look at someone who started investing ¥10,000 a month at that exact same terrible peak:

According to calculations from Nomura Securities, the monthly investor went through brutal years too. By February 2009 their ¥2.31 million of contributions was worth just ¥1.15 million. But they kept going. By April 2013 they were back in profit, and by March 2024 their ¥4.12 million had grown to about ¥10.77 million, roughly 2.6 times the money they had put in. All that while the lump-sum investor was only just getting back to even.
This is no surprise to researchers. In PWL Capital's six-country study, Japan had the lowest lump-sum win rate of all, about 58%. Long, grinding bear markets are exactly where monthly investing shines.
4. 1929: the "25-year recovery" that wasn't
You may have heard that it took 25 years for stocks to recover from the 1929 crash. On paper, the Dow Jones Industrial Average did not regain its September 1929 high until November 1954. But in an April 2009 New York Times column, investment writer Mark Hulbert showed that this figure is badly misleading. Once you include dividends (the dividend yield was close to 14% at the 1932 low) and the falling prices of the Depression, an investor who put a lump sum in at the 1929 peak was back to even by late 1936. That is about seven years, not twenty-five.
Seven years is still painful. But it is a very different story from the one that scares people out of the market for life. And an investor who kept adding money monthly through the early 1930s, buying shares at Depression prices, would have recovered faster still.
So Which Should You Choose? The 3-Question Test
You now know more about this question than most financial advisers. Let's turn it into a decision. Answer these three questions honestly:
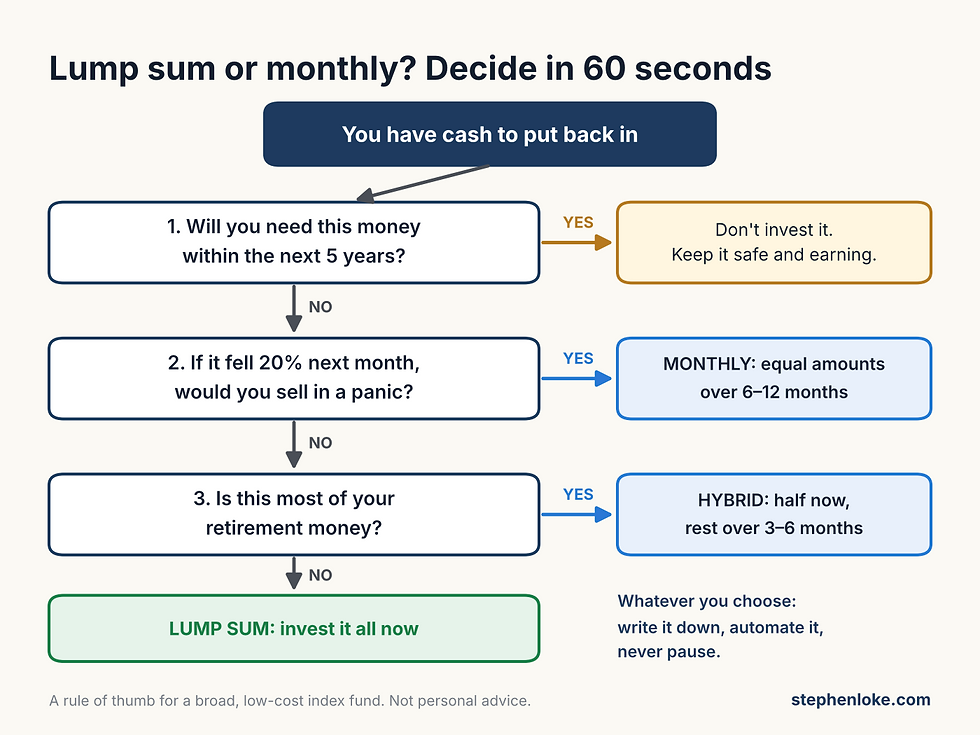
Question 1: Will you need this money within the next five years? If yes, it should not be in the stock market at all, lump sum or monthly. Keep it somewhere safe and earning interest. Also make sure you have an emergency fund of at least six months of expenses, so a surprise bill never forces you to sell at a bad time.
Question 2: If the market fell 20% the month after you invested, would you sell in a panic? Be brutally honest. The best predictor of your future behavior is your past behavior. If you sold during the last crash, the answer is yes, and that is nothing to be ashamed of. It simply means a monthly schedule of 6 to 12 months is your best friend.
Question 3: Is this most of your retirement money? If yes, a hybrid makes sense: invest half now and spread the rest over three to six months. You capture most of the lump-sum advantage while protecting yourself from the worst regret. If the amount is a modest part of your wealth, the data says invest it now.
Here is how the options compare side by side:
Approach | Expected result | Regret if a crash hits soon | Best for |
Lump sum (all now) | Highest on average, wins about 2 in 3 times | Highest | Calm investors with a long horizon |
Hybrid (half now, rest over 3–6 months) | Close to lump sum | Moderate | Large sums, first time back after a loss |
Monthly over 6–12 months | Slightly lower on average | Lowest | Recently burned or nervous investors |
Waiting for a dip | Lowest by far | Very high (missed rebounds) | Nobody |
The Re-Entry Playbook: 7 Rules for Putting Money Back to Work

Choosing lump sum or monthly is the easy part. Doing it without wobbling is where most people fail. These seven rules close every loophole your nervous system will try to use.
Rule 1: Write your plan on one page before you invest
Write down the amount, the fund, the schedule, the end date, and one more line: "If the market falls 20% during this plan, I will keep going." Sign and date it. A written decision is far harder to abandon at 2 a.m. than a vague intention. If you are still too shaken to think clearly, start with Can't Sleep After a Big Stock Loss? 9 Things to Do Before You Touch Your Portfolio Again.
Rule 2: Pick a short window, 3 to 12 months
Never "until it feels safe." It will feel safe only after prices are much higher. The research is clear that the longer you stretch your schedule, the more it costs you: a 36-month spread lost to the lump sum about 90% of the time. For most people, six months is the sweet spot.
Rule 3: Same amount, same date, every month, on autopilot
Most brokers and fund platforms let you set up an automatic recurring investment. Use it. Pick a date, such as the 1st of each month, and let the machine do it. Every decision you remove is one less chance for fear to interfere.
Rule 4: Never pause. You may speed up, but never slow down
This is the rule that makes monthly investing work. If prices fall during your plan, you are not losing. You are buying more shares for the same money. Look at this simple illustration of $60,000 invested over six months while the market dips and recovers:
Month | Price per share | Amount invested | Shares bought |
1 | $100 | $10,000 | 100.0 |
2 | $90 | $10,000 | 111.1 |
3 | $80 | $10,000 | 125.0 |
4 | $85 | $10,000 | 117.6 |
5 | $95 | $10,000 | 105.3 |
6 | $100 | $10,000 | 100.0 |
Total | Ends where it started | $60,000 | 659.0 shares |
The price finished exactly where it began, yet those 659 shares are now worth about $65,900, a gain of nearly 10%. Your average cost per share was $91.04. The monthly investor who kept going through the dip came out ahead. The one who paused at month three did not.
One optional exception: if the market falls 20% or more from where you started, you may invest the remaining installments early. Speeding up when prices are low is fine. Slowing down never is.
Rule 5: Park waiting cash somewhere safe that pays interest
The money waiting for its turn should sit in a high-interest savings account, a money market fund, short-term government bills or a fixed deposit that matures on schedule. It should not be used for "just one quick trade" while it waits.
Rule 6: Buy the whole market, not the stock that hurt you
The break-even trap whispers that you should put the money back into the same stock that burned you, so you can win it back. Don't. The goal is not to recover that particular loss. The goal is to rebuild your wealth. A broad, low-cost index fund spreads your money across hundreds of companies, so no single disaster can wipe you out again. My plain-English guide Index Funds for People Who've Been Burned explains why. And if you are still holding a losing position, read Should You Sell at a Loss or Wait to Break Even? first.
Rule 7: Keep adding every month after the money is in
The re-entry plan should not end at month six. It should become a habit. Remember the Fidelity study: investors who kept contributing through the crash grew their balances by 64%, compared with 26% for those who stopped. For a full step-by-step recovery roadmap, see Down 50%? A 12-Month Plan to Rebuild Your Portfolio Without Taking Bigger Risks.

What If the Market Crashes Right After I Invest?
This is the nightmare that keeps most burned investors frozen, so let's face it directly.
First, it will happen at some point. Hartford Funds, using data from Ned Davis Research, counted 27 bear markets since 1928, roughly one every 3.5 years over the long run, or about one every five years since 1945. The average bear market lasted 289 days and fell about 35%. The average bull market lasted 988 days and gained about 112%. If you invest for 15 years, expect to live through two or three bear markets. That is not a sign your plan failed. That is the normal price of the long-term returns.
Second, understand the recovery math, because it explains why losses feel so permanent:
Loss | Gain needed to get back to even |
10% | 11.1% |
20% | 25.0% |
30% | 42.9% |
40% | 66.7% |
50% | 100.0% |
That table is frightening for someone who owns one stock. It is far less frightening for someone with a diversified index fund who keeps adding money, because new money buys at the lower prices and does a great deal of the recovery work. I explain the full math in How Long Does It Take to Recover From a 50% Stock Market Loss?
Third, protect the money you will need soon. If you are in your 50s or 60s, keep two to three years of planned spending in cash or high-quality bonds, so a crash never forces you to sell. If you are worried that time is running out, read You Lost Money in the Stock Market at 50. Is It Too Late to Retire Comfortably?
And finally, remember Buffett. He invested and the market fell another 28%. Four and a half years later, he was well ahead. A crash right after you invest feels like the end of the world. For a long-term investor who keeps going, it usually turns out to be a sale.
Key insight The investors who get hurt most by a crash right after investing are not the ones who chose lump sum. They are the ones who sold in a panic afterward. Your re-entry plan is only as strong as your promise not to undo it. |
Frequently Asked Questions
Is it better to invest a lump sum or monthly?
On average, investing a lump sum wins. Vanguard found it beat spreading the money over 12 months about two-thirds of the time, because markets rise more often than they fall. But spreading your money over 3 to 12 months reduces the chance of a painful early loss. If a drop right after investing would make you sell, investing monthly is the wiser choice for you.
Should I wait for the market to drop before investing my cash?
History says no. In Schwab's 20-year study, the investor who kept waiting in cash ended with less than a third of what even the worst market timer earned. The market's best days often come right after its worst days, so waiting for a dip usually means missing the rebound.
How long should I spread out a lump sum?
Between 3 and 12 months. The longer you stretch it, the more it tends to cost you. When Vanguard tested a 36-month spread, the lump sum won about 90% of the time. For most people, six months is a sensible middle ground.
What if the market crashes right after I invest a lump sum?
It can happen, and it is survivable if you do not sell. Warren Buffett told the world to buy in October 2008, and the market fell another 28% before bottoming in March 2009. By March 2013 it was about 66% above where he bought. The real damage comes from panic selling, not from the crash itself.
Is dollar-cost averaging a good idea after a big loss?
Often, yes. After a loss, your brain feels new losses even more sharply, and many people freeze or sell at the next dip. A fixed, automatic monthly schedule removes those emotional decisions. It earns slightly less on average, but it is far better than staying in cash, which it beat about 69% of the time in Vanguard's 2023 study.
Where should I keep my cash while I invest it monthly?
Somewhere safe that pays interest, such as a high-interest savings account, a money market fund, short-term government bills or fixed deposits timed to your schedule. Avoid using the waiting money for short-term trades.
Does dollar-cost averaging work in a falling market?
That is where it works best. An investor who put ¥10,000 a month into Japan's Nikkei 225 starting at its 1989 peak was back in profit by 2013 and had about 2.6 times their money by 2024, even though a lump sum invested at the peak took 34 years to break even.
Should I put money back into the stock that lost me money?
Usually not. Trying to win back a loss in the same stock is the break-even trap, a well-documented behavior that leads people to take bigger risks after a loss. A broad, low-cost index fund spreads your money across hundreds of companies, so no single failure can wipe you out again.
The Bottom Line: Don't Let the Last Crash Choose for You
Let's go back to Cheryl Friedman one last time. She was not foolish. She was frightened, and fear made the decision for her. That is the real risk after a big loss: not that you pick lump sum when monthly would have been slightly better, or monthly when lump sum would have been slightly better. The real risk is that you let the last crash decide your next 20 years.
Here is everything in one paragraph. If you are calm and the money is a modest share of your wealth, invest it now. If you are nervous, recently burned, or this is your retirement nest egg, invest it in equal monthly amounts over 3 to 12 months, or put half in now and spread the rest. Write the plan down. Automate it. Never pause. Buy the whole market. And keep adding every month for as long as you can.
The late John Bogle, founder of Vanguard and the father of the index fund, was once asked what ordinary people should do in a falling market. Part of his answer was simple: "Do it gradually is always good advice." Gradual is fine. Lump sum is fine. Never is the only choice that reliably fails.
Your money has been sitting on the sidelines long enough. It is time to put it back in the game, on your terms, with a plan.
FREE REPORT: Why You Lost Money in the Stock Market (And Why It Wasn't Your Fault) Before you put a single dollar back into the market, find out exactly what burned you, so it never happens again. My free report reveals the 7 Wall Street traps that quietly drain ordinary investors, why the timing of your money matters far less than the system you use, and the one boring strategy the industry hopes you never discover. Written in plain English for investors over 40 who have lost money and want a calm, proven way to rebuild. 100% free. Instant download. No credit card. |
Important: This article is for education only and is not personal financial, investment or tax advice. Past performance does not guarantee future results. Study results depend on the time periods, markets and assumptions used, and the six-month example is an illustration, not a forecast. Stocks and index funds can lose value. Please consider your own situation and speak with a licensed adviser before investing.
Sources
Northwestern Mutual, "Is Dollar-Cost Averaging Better Than Lump-Sum Investing?"
Ben Felix, "Dollar Cost Averaging vs. Lump Sum Investing," PWL Capital (June 2020)
Schwab Center for Financial Research, "Does Market Timing Work?" (July 2025)
"The Price of Panic" (Vanguard data on investors who went to cash in 2020), Financial Advisor (2020)
J.P. Morgan Asset Management, Guide to the Markets, U.S. 4Q 2026
Hartford Funds, "10 Things You Should Know About Bear Markets" (2025)
Aswath Damodaran, Historical Returns on Stocks, Bonds and Bills, NYU Stern (January 2026)
Warren E. Buffett, "Buy American. I Am.," The New York Times (October 2008)
"1,569: S&P Closes at All-Time High, Rising Above Oct. 2007 Mark," NPR (March 28, 2013)
Mark Hulbert, column on the true recovery time after 1929, The New York Times (April 26, 2009)
Nomura Securities, monthly investing in the Nikkei 225 from the 1989 peak (May 2024, in Japanese)
"S&P 500 closes at a record, erasing last of pandemic losses," PBS NewsHour / AP (August 2020)
Associated Press report on the April 9, 2025 rally after the tariff pause, The Dallas Morning News
Associated Press report on the S&P 500's record close, WUFT (June 27, 2025)
"How major US stock indexes fared Wednesday, 4/15/2026," Associated Press
"Let cooler heads prevail" (interview with John Bogle), Marketplace (April 25, 2008)



Comments