Can the S&P 500 Go to Zero? What Would Have to Happen, and Why It Never Has

On March 9, 2009, the S&P 500 closed at 676.53.
In 17 months it had lost 56.8% of its value. Lehman Brothers was gone. Banks were being rescued over weekends. And millions of ordinary investors stared at their statements and asked the same question you just typed into Google: what if this goes all the way to zero?
Here's the plain answer. Can the S&P 500 go to zero? In theory, yes. In practice, it would take all of America's roughly 500 largest companies becoming worthless at the same moment, with nobody left to replace them. That has never happened. Not in the 1929 crash, not in 2008, not in 2020. The worst fall on record was 86%, and the index went on to new highs.
The Short Answer (Save This) ✔ Zero needs everyone to fail at once. The index is about 500 companies worth roughly $67 trillion together. Every one of them would have to be worth nothing on the same day. ✔ The index repairs itself. Failing companies shrink, get thrown out and are replaced. Enron was replaced by Nvidia, which later became the biggest company in the index. ✔ The worst fall was 86%, from 1929 to 1932. Two of the biggest in living memory were 56.8% (2007 to 2009) and 33.9% (2020). Every one was followed by new highs. ✔ Whole stock markets have gone to zero, but only when governments seized private companies, as in Russia in 1917 and China in 1949. ✔ The index rarely ruins people. The way they hold it does: borrowed money, leveraged funds, single stocks and selling at the bottom. |
In this article, I'll show you exactly what would have to happen for the S&P 500 to hit zero, the two times whole stock markets really did, the real swaps that keep the index alive, and the five ways investors still lose everything while the index survives.
What's inside this article:
Why This Fear Feels So Real
If you've lost money in the stock market, this question isn't academic. You may have watched a stock you owned sink to almost nothing. When that happens even once, your brain draws a simple line: if my stock could go to zero, why not the whole market?
That fear is built on something true. Individual stocks really do go to zero, and far more often than most people think.
J.P. Morgan studied the stocks in the Russell 3000 index from 1980 to 2014. About 40% of them suffered what the bank called a "catastrophic loss": a fall of 70% or more from their peak, with little recovery afterwards. Roughly two out of three trailed the index over their lifetimes.
Professor Hendrik Bessembinder of Arizona State University went further. He studied nearly 26,000 US stocks from 1926 to 2016. 58% of them failed to beat the return on Treasury bills over their lifetimes. Just 4.3% of companies created all of the stock market's net wealth above Treasury bills.
So your fear isn't silly. It's just pointed at the wrong target. A single company is a fragile thing. An index of hundreds of companies that is constantly refreshed is a very different animal. If you've been burned by single stocks and want to understand why it happens to smart people, I unpack it in Why Smart People Lose Money in the Stock Market: 8 Mental Traps and How to Escape Them.
What "Going to Zero" Would Actually Take
Let's be precise about what the S&P 500 is, because the answer is hidden inside the definition.
The S&P 500 is a list of about 500 large US companies, weighted by their size. At the end of July 2026, it held 503 stocks with a combined value of about $67 trillion, according to S&P Dow Jones Indices. The median company in the index was worth about $43.7 billion. Even the smallest was worth about $5.7 billion.
For the index to reach zero, the value of all 503 companies would have to fall to zero together. Not most of them. All of them. Every bank, every drug maker, every supermarket chain, every power company that keeps the lights on, every software maker and every railroad.
The Zero Test: What If the Giants Vanished Overnight?
Here's a thought experiment I call the Zero Test. Imagine the very biggest companies in the index vanished overnight, with no warning and nothing left for shareholders. Using the index weights at the end of July 2026:
What vanishes overnight | What you lose | What you still own |
The single largest company (Nvidia) | 7.6% | 92.4% |
The 10 largest companies | 37.6% | 62.4% |
All 503 companies at once | 100% | 0% |
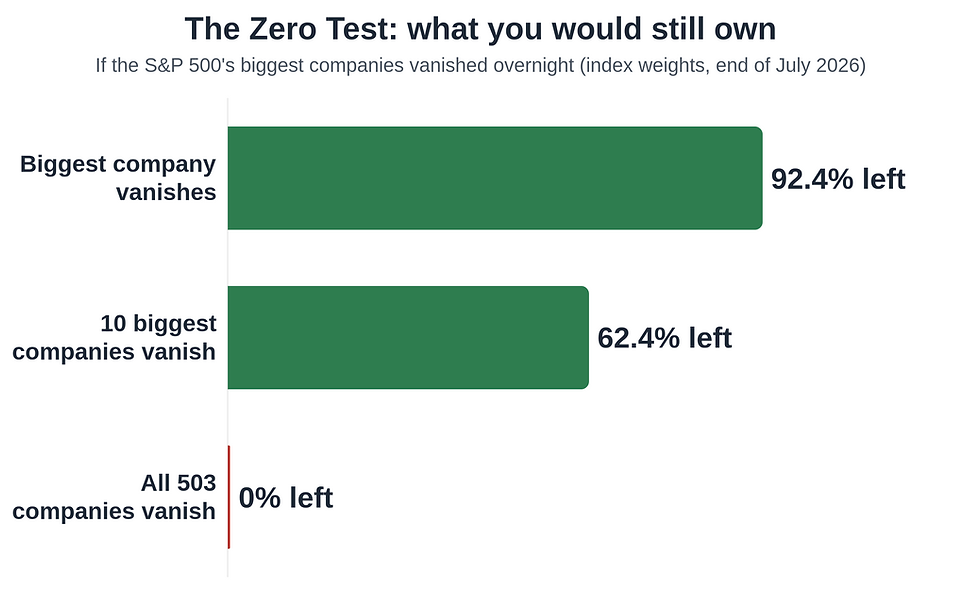
Read the middle row again. If the ten biggest companies in America, the household names you use every day, all went bust on the same night, an S&P 500 investor would still hold 62.4% of their money. It would be one of the worst days in history. It would not be zero.
And giants rarely die overnight. They usually shrink over months or years. As they shrink, their weight in the index shrinks too, so they hurt you less on the way down.
The Index Has a Built-In Repair Crew
This is the part most investors never hear about.
The S&P 500 isn't a fixed list. A committee at S&P Dow Jones Indices decides who gets in and who gets thrown out. Under the rules in its July 2026 methodology, a company generally must:
Be a US company, listed on a US exchange.
Be big: worth at least $22.7 billion in total market value.
Be profitable: positive earnings in its latest quarter, and positive earnings when you add up its last four quarters.
Trade actively, with enough shares available for the public to buy.
When a member company collapses, it doesn't drag the index down with it. It falls, its weight falls with it, and then it's removed and replaced by a healthy company that passes those tests. The index sheds its failures and adds the next generation of winners.
Think of it like a football club that automatically drops its injured players and signs the best new talent, every season, forever. The club's name stays the same. The players keep changing.
Three Real Swaps That Prove It
You don't have to take this on faith. Here are three real collapses, and what replaced them.
Year | Company that collapsed | What happened | Replaced by |
2001 | Enron | Accounting scandal and bankruptcy | Nvidia |
2008 | Lehman Brothers | Bankruptcy in the financial crisis | Harris Corp. |
2023 | SVB Financial (Silicon Valley Bank) | Bank failure, taken over by the FDIC | Insulet |
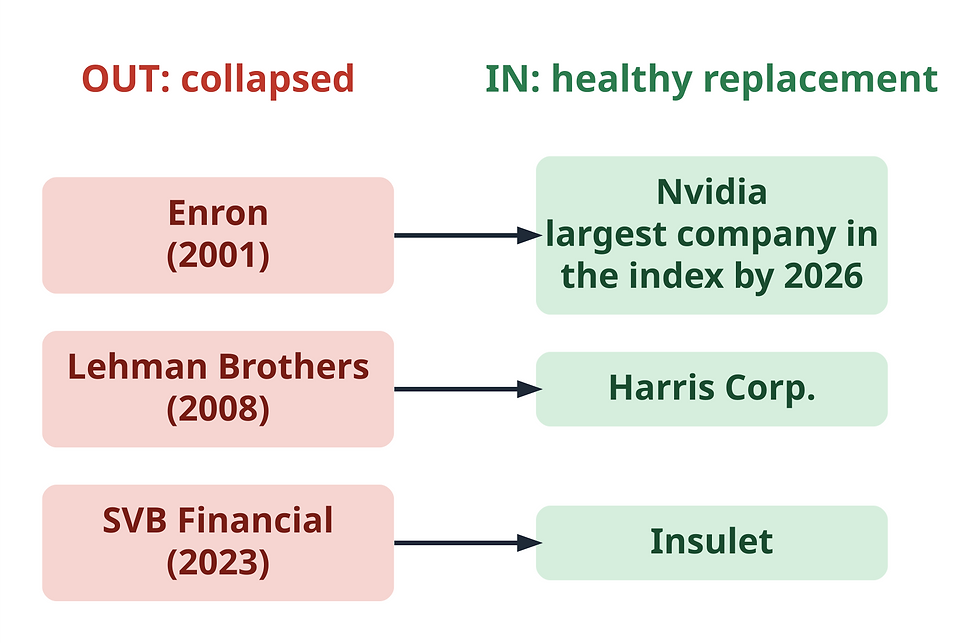
The Enron story is my favourite. On November 29, 2001, as Enron's shares collapsed, S&P removed Enron from the index. Its replacement was a graphics chip maker called Nvidia, whose shares closed that day at $53.61. Index funds had to buy it.
Fast forward to July 2026. Nvidia was the single largest company in the S&P 500, worth about $4.86 trillion and making up 7.6% of the whole index.
Think about what that means for an ordinary index investor. You owned Enron when it failed, and that hurt a little. But the same index then handed you Nvidia, the company that would grow into the biggest business in the index. You didn't need to spot it. You didn't need to read a single analyst report. The index did it for you, automatically.
When Lehman Brothers filed for bankruptcy in September 2008, it was removed from the index after the close of trading on September 16 and replaced by Harris Corp. When Silicon Valley Bank failed in March 2023, S&P said its parent company was no longer eligible because it had been placed into FDIC receivership. Insulet, a medical device maker, replaced it before trading opened on March 15.
Each time, people who owned only that one stock lost almost everything. People who owned the index lost a sliver, and the index carried on. I show the exact dollar cost of one company failing inside your fund in Is Your Money Safe in an Index Fund? What Happens If a Company, or Even Vanguard, Goes Bankrupt.

The Worst It Has Ever Been: Every Big Crash, and What Came Next
Now let's look at the scariest numbers honestly. The S&P 500 has fallen a long way, several times. Here are its biggest crashes, measured from closing high to closing low.
Crash | Fall from the peak | Value left at the bottom | Bottom to new high (price only) |
1929 to 1932, Great Depression | 86.2% | 13.8% | About 22 years |
1973 to 1974, oil shock | 48.2% | 51.8% | About 6 years |
2000 to 2002, dot-com bust | 49.1% | 50.9% | About 4.6 years |
2007 to 2009, financial crisis | 56.8% | 43.2% | About 4 years |
2020, COVID-19 | 33.9% | 66.1% | About 5 months |
2022, inflation scare | 25.4% | 74.6% | About 15 months |
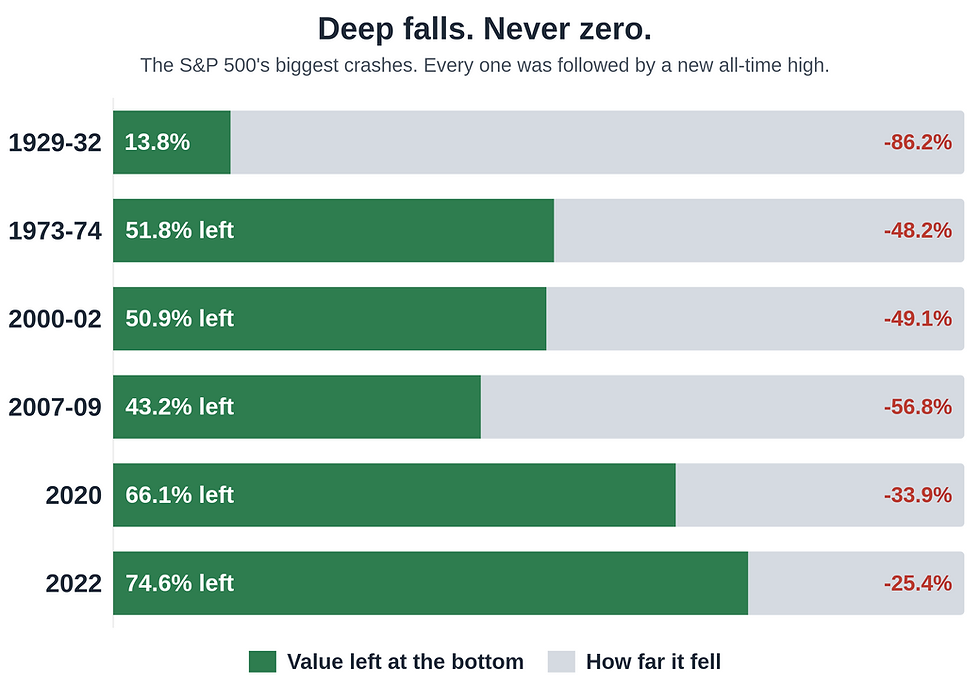
Look at the third column. Even at the darkest moment of the Great Depression, the index still held 13.8% of its value. It never reached zero. And every one of these crashes ended with a new all-time high.
The lowest close in the index's history came in June 1932, at 4.43. (That's the S&P composite that came before the S&P 500, which launched in its current form on March 4, 1957.) On October 6, 2026, the S&P 500 closed at a record 7,818.93. That's more than 1,700 times higher, before counting a single dividend.
One more thing about that 22-year figure for the Great Depression. It's the number everyone quotes, but it ignores dividends and the fact that prices of everyday goods fell sharply in the 1930s. Counting both, the break-even point came much sooner. Market historian Mark Hulbert put it at late 1936 for the average stock. The UBS Global Investment Returns Yearbook, measuring after inflation, puts the recovery at February 1945. Either way, it's far shorter than the scary headline number.
The Worst Single Day
The fastest crash came on Monday, October 19, 1987, remembered as Black Monday. The S&P 500 fell 20.47% in a single session, its worst day ever.
The rules have changed since then. Today, US markets use "circuit breakers" tied to the S&P 500. A 7% fall pauses all trading for 15 minutes, and so does a 13% fall, if either happens before 3:25 p.m. A 20% fall stops trading for the rest of the day. These rules don't make crashes impossible, but they're designed to slow a panic down so people have time to think.
So What Would Have to Happen? The 4 Roads to Zero
This question deserves a real answer, not just "don't worry about it." As far as history and common sense can tell us, there are only four roads that could lead an entire stock market to zero. Only one of them has ever been travelled.
Road No. 1: Revolution and Confiscation (This Has Really Happened)
This is the one road with real history behind it, so I want to be honest with you about it.
In 1917, the Russian Revolution closed the country's stock market. In 1949, the Communist takeover did the same in mainland China. The economists behind the UBS Global Investment Returns Yearbook, which tracks stock markets back to 1900, treat shareholders in both countries as suffering total losses. The companies didn't simply go bust. The state took them.
Two professors, Philippe Jorion and William Goetzmann, studied 39 stock markets over most of the 20th century. They found that war, political upheaval and confiscation interrupted markets far more often than most investors assume, and that the US market was the exception, not the rule. US stocks had the highest uninterrupted real return in their study, about 4.73% a year, against a median of about 1.5% for the other countries.
So here is the honest truth. A stock market can go to zero if the government decides private ownership is over. For the S&P 500, that would mean the United States abolishing private property and seizing every listed company. In that world, your bank deposits, your house and your pension would be in the same danger.
Road No. 2: The End of Normal Life
A full nuclear war, a planet-killing asteroid, something that ends ordinary life as we know it. In that world the S&P 500 might well be worth nothing. So might cash, bonds, property deeds and even gold, because there would be no working system to trade them in.
You can't plan a retirement around this, and nothing in any portfolio would protect you from it. It's not a reason to avoid investing. It's a reason to stop worrying about it.
Road No. 3: The Dollar Collapses (Surprise: the Index Goes Up)
Many people assume that if the US dollar collapsed, stocks would go to zero. History points the other way, at least in the price you see on the screen.
Look at Zimbabwe in 2008. As the Zimbabwe dollar collapsed, with official inflation of 165,000% in February, the Zimbabwe Stock Exchange industrial index rocketed from just over 1.2 billion points at the start of the year to above 900 billion points by early June.
Why? Because a share is a slice of a real business: its factories, its brands, its customers. When money loses its value, the price of real things, measured in that money, goes up. In a currency collapse, it's the cash under the mattress that goes to zero, not ownership of businesses. You'd still lose in real terms, and it would be a disaster, but the index wouldn't hit zero.
Road No. 4: Every Company Fails at Once
The last road is the one most people picture: a depression so deep that every company goes bankrupt together.
The Great Depression is the closest the US has come to this road. Even then, at the very worst moment, the index still held 13.8% of its value. People still bought food, medicine, electricity, fuel and soap. The businesses selling those things still had customers.
Today, many of these companies also earn a big share of their money outside America. In technology, the largest part of the index, more than half of sales came from outside North America as of September 2026, according to FactSet data published by First Trust. A US-only disaster wouldn't stop the rest of the world buying their products.
Then there's the cash they hand back to owners. In 2025, S&P 500 companies paid a record $78.92 in dividends for each share of the index, and 409 of them paid a dividend in the final quarter of the year, according to S&P Dow Jones Indices. Businesses that send real cash to their owners, quarter after quarter, are not businesses about to disappear together.
Road to zero | Has it happened? | Would the S&P 500 hit zero? |
Revolution and confiscation | Yes: Russia 1917, China 1949 | Yes, and most other assets would be at risk too |
End of normal life | No | Possibly, but so would almost everything else |
Currency collapse | Yes, elsewhere (Zimbabwe 2008) | No. Share prices rise in the dying currency |
Every company fails at once | No, not even in 1932 | No. The worst was an 86% fall |
What Happened to the People Who Bet on Zero
Every big crash produces confident voices predicting total collapse. Here's one famous example, because it shows what those predictions cost the people who followed them.
In July 2010, with the Dow Jones Industrial Average at about 9,686, the well-known market forecaster Robert Prechter was quoted in The New York Times and on the radio show Marketplace predicting that the Dow would fall well below 1,000 over the next five or six years. That's a fall of about 90%. He advised ordinary investors to move into cash and Treasury bills.
It didn't happen. The S&P 500, which ended that same week at a new low for 2010 of just over 1,000, went on to a record close of 7,818.93 in October 2026, more than seven times higher.
I'm not sharing this to mock anyone. Forecasting is hard, and plenty of smart people get it wrong. I'm sharing it because of what it means for you. The investor who sells everything to "protect" themselves from zero isn't playing it safe. They're making a huge bet of their own, and history has been brutal to that bet.
A Worked Example: $100,000 at the Worst Possible Moment
Let's put real numbers on it. Suppose you put $100,000 into an S&P 500 index fund at the very top, on October 9, 2007, when the index closed at 1,565.15. Terrible timing.
By March 9, 2009, the index had fallen to 676.53. Your $100,000 was now worth about $43,224 on paper. This is the moment when zero felt like it was coming.
Now follow two investors:
Investor A sold at the bottom "to stop the bleeding." They locked in $43,224, plus whatever interest cash earned afterwards.
Investor B did nothing. By October 6, 2026, the index stood at 7,818.93. Their $100,000 was worth about $499,560, and that's on price alone, before a single dividend.
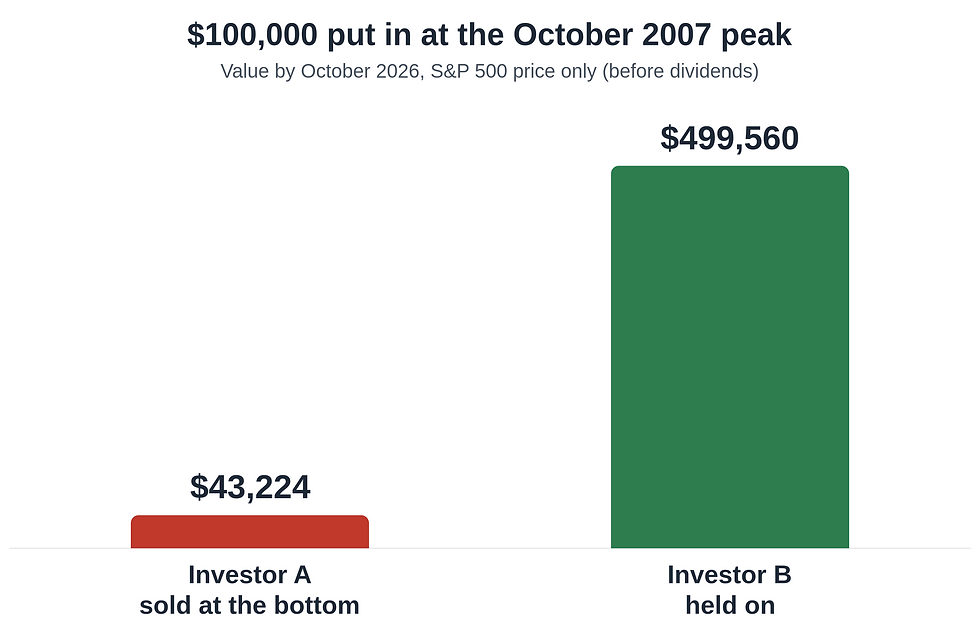
Same money. Same terrible starting point. Same crash. Investor B ended up with more than 11 times as much as Investor A. The only difference was what each one did when it felt like the end of the world.
The math of recovering from a big fall is brutal and surprisingly hopeful at the same time. I break it down step by step in How Long Does It Take to Recover From a 50% Stock Market Loss? The Math Nobody Shows You. And if you're living through a fall right now, read The Market Just Dropped 20%. Here's What Calm Investors Do Next.
The Index Doesn't Go to Zero. Investors Do: The 5 Real Ways
Here's the uncomfortable truth every burned investor deserves to hear. In every crash, some people really do lose everything. It almost never happens because the index went to zero. It happens because of how they owned it.
No. 1: Owning a Few Stocks Instead of the Whole Index
Remember: about 40% of stocks in J.P. Morgan's study suffered a permanent fall of 70% or more. Enron, Lehman and SVB shareholders were wiped out. Index investors who owned those same companies barely noticed. If you're not sure whether your portfolio is closer to investing or gambling, see 7 Signs You're Gambling in the Stock Market, Not Investing.
No. 2: Borrowed Money
Borrowing to invest, called buying on margin, turns a survivable fall into a fatal one. The US Securities and Exchange Commission warns plainly that in a margin account you can lose more money than you put in, and that your broker can sell your holdings without asking you. That often happens right near the bottom.
The math is simple. Buy with half your own money and half borrowed money, and a 50% fall wipes out your half completely. The 2007 to 2009 crash was 56.8%. An index investor who held on recovered. An investor geared up two to one was wiped out, usually by a margin call before the bottom ever arrived.
The most famous recent example is Archegos Capital Management. Run by Bill Hwang, it managed about $36 billion at its peak and used money borrowed from banks to make even bigger bets. In March 2021, when some of its big stock positions fell, Archegos couldn't meet its margin calls and was wiped out in less than a week. Banks were left with about $10 billion in losses. Hwang was later sentenced to 18 years in prison for fraud.
The stocks didn't go to zero. The borrowing sent the fund there.
No. 3: Leveraged and Inverse Funds
Some funds promise two or three times the daily move of an index. They sound like a turbo-charged S&P 500. They're not.
These funds reset every single day, so over weeks and months their results can drift far from what you'd expect. In a 2023 bulletin, the SEC and FINRA gave this example: over four months, an index gained about 8%, yet a fund promising three times its daily move lost 53%, and a three-times inverse fund lost 90%. Their verdict: these are specialised products that generally aren't suitable for buy-and-hold investors.

Now imagine one of those funds on Black Monday 1987. A fund built to deliver three times the daily move would have lost about 61% in that single session.
It has happened to a cousin of these products. On February 5, 2018, an exchange-traded note called XIV, which was a bet on calm markets, lost 96.3% in one day, falling from $115.55 to $4.22. Its issuer, Credit Suisse, shut it down. The stock market didn't go to zero that day. XIV almost did.
No. 4: Options and Other "Fast Money" Bets
Options can expire worthless, which means your money can go to exactly zero on a known date, even while the index is perfectly fine. If that's happened to you, please start with Lost Your Savings Trading Options? What to Do in the First 30 Days.
No. 5: Selling at the Bottom
This is the quiet one. It doesn't send your account to zero, but it can turn a temporary fall into a permanent loss, as Investor A found out. The index has never gone to zero, but a single panicked click can make a crash permanent for you.
The Honest Risks: The S&P 500 Doesn't Need to Hit Zero to Hurt You
I'd be doing you a disservice if I stopped at "it won't go to zero." Here are the real risks I'd want you to plan for.
Long, flat stretches. Someone who bought at the March 2000 peak sat through two crashes and spent most of the next 13 years below their purchase price, on price alone.
Japan's warning. Japan's Nikkei 225 index peaked at 38,915.87 on December 29, 1989. By October 2008 it had fallen about 82%, and it didn't set a new closing record until February 22, 2024, more than 34 years later. Japan's market never went to zero, but someone who put everything in at the top waited half a lifetime.
America isn't guaranteed to stay the winner. Jorion and Goetzmann's research is a reminder that the US was the best performer of the 20th century, and past winners don't always stay winners.
Concentration. "500 companies" sounds very spread out. But at the end of July 2026, the 10 largest made up 37.6% of the index. That isn't a zero risk, but it does mean a fall in a handful of technology giants can hit you hard.
What protects you from these real risks isn't fear. It's structure:
Time: money you'll need within about five years shouldn't depend on the stock market.
A cash buffer: an emergency fund means a crash never forces you to sell.
Regular investing: buying every month means you automatically buy more shares when prices are low. If you're deciding how to put money back in after a loss, see Lump Sum or Monthly? How to Put Money Back Into the Market After a Big Loss.
Wider diversification: many investors pair an S&P 500 fund with a global or total-market index fund, so they're not betting only on America. If you live outside the US, my guide How to Invest in the S&P 500 If You Live Outside the United States covers the practical side.
Could My Investment Go to Zero? A 60-Second Check
Use this simple flowchart on every holding in your account. It takes about a minute, and it tells you where your real "zero risk" sits.
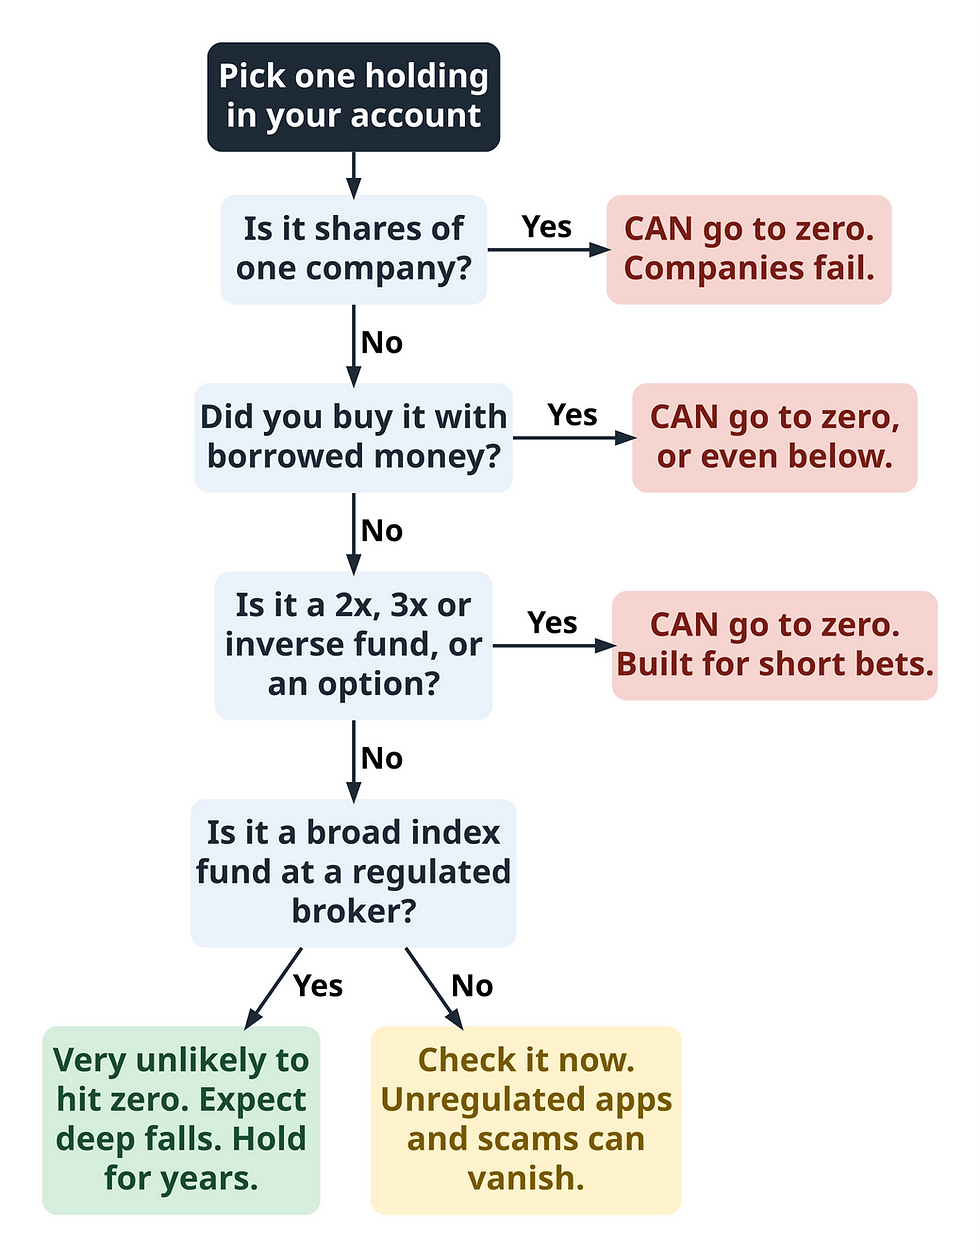
Most burned investors who run this check find that the things that hurt them sit in the top three boxes, not the bottom one. That's good news. It means the fix is in your hands.
The Zero-Proof Checklist
Own the whole haystack, not a few needles. Use a broad index fund that holds hundreds of companies.
Never borrow to invest. No margin loans, and no borrowing against your home to buy shares.
Skip leveraged and inverse funds. If the name includes 2x, 3x, Ultra or Bear, it isn't a long-term holding.
Keep three to six months of expenses in cash, so a crash never forces you to sell.
Match the money to the time. Money you'll need within about five years stays out of the stock market.
Use a regulated broker and a registered fund, so the money you see is really there.
Write your crash plan now. One sentence: "If the market falls 30%, I will ___." Keep it where you'll see it.
Check your portfolio less often. Daily checking turns normal ups and downs into daily alarms.
What to Do Tonight
Open your account and list what you own. Mark anything that's a single stock, a leveraged fund, an option or a margin position.
Run the flowchart above on each item.
Check whether margin is switched on. If you never meant to borrow, ask your broker how to change to a cash account.
Write your one-sentence crash plan and save it on your phone or stick it on your fridge.
Bookmark this article, and re-read the Enron and Nvidia story the next time the headlines scream "collapse."
Frequently Asked Questions
Can the S&P 500 go to zero?
In theory, yes, but all of its roughly 500 companies would have to become worthless at the same time. That has never happened. Its worst fall was 86% from 1929 to 1932, and its most recent big one was 56.8% from 2007 to 2009. Both were followed by new record highs.
Has the S&P 500 ever gone to zero?
No. Neither the S&P 500, launched in 1957, nor the S&P composite before it has ever gone to zero. Its lowest close was 4.43 in June 1932. In October 2026 it set a record close of 7,818.93, more than 1,700 times higher before counting dividends.
Can index funds go to zero?
A broad stock index fund would only go to zero if every company in it failed together. Leveraged and inverse funds are different. A three-times leveraged fund can lose most of its value quickly, and some related products have been shut down after huge one-day losses, such as XIV in 2018.
What would happen if the S&P 500 went to zero?
It would mean every major US company was worthless at once. In practice, that means the state seizing private companies or a collapse of ordinary life. In that world, cash, bonds, bank deposits and property would be at risk too. No investment could protect you from it.
Can the stock market go to zero?
Whole markets have gone to zero, but only when governments seized private companies, as in Russia in 1917 and China in 1949. Ordinary crashes and depressions haven't done it. Even in hyperinflation, share prices usually rise in the local currency, because shares are claims on real businesses.
Can VOO go to zero?
VOO is Vanguard's S&P 500 ETF, so it would only go to zero if the S&P 500 did. Its stocks are held by a separate custodian bank, so even a failure at Vanguard wouldn't wipe out the fund. The realistic risk is a deep, temporary fall, not zero.
What is the lowest the S&P 500 has ever been?
Its lowest close was 4.43 in June 1932, near the bottom of the Great Depression. That figure is for the S&P composite that came before today's index. Since the S&P 500 launched in 1957, its deepest fall was 56.8%, ending at 676.53 on March 9, 2009.
Is the S&P 500 a safe investment?
It isn't safe in the sense of never falling. It has dropped more than 50% three times since 1929. But it has never gone to zero and has recovered from every crash so far. It suits money you can leave invested for many years, not money you'll need soon.
The Bottom Line

The S&P 500 is not a promise. It falls, sometimes by half, and those falls are frightening while you're living through them.
But "going to zero" would take something far bigger than any crash: the end of private ownership, or the end of ordinary life. Short of that, the index keeps doing the one thing no single stock can do. It throws out its failures and replaces them with the next generation of winners, quietly, every year.
If you've been burned before, the lesson isn't to fear the market forever. It's to stop owning it in the ways that burn people, and to own it in the boring way that has survived every storm so far. For a calm, step-by-step way to start again, read Index Funds for People Who've Been Burned: A Plain-English Guide to Starting Over.
About the Author Stephen Loke has been a student of the market for more than 15 years. He is also an agritourism entrepreneur whose farm has been featured in Bloomberg News and Asahi Shimbun. Important: This article is general education, not personal financial advice. I'm not a licensed financial adviser, and nothing here is a recommendation to buy or sell any investment. Past performance doesn't guarantee future results. Please consider your own situation, or speak to a licensed adviser, before making investment decisions. |
Free Report for Investors Who've Been Burned "Why You Lost Money in the Stock Market (And Why It Wasn't Your Fault)" shows the hidden traps that drain ordinary investors and the calm, simple way to start rebuilding. It's free. Tap the button below to get your copy. |
Sources
S&P Dow Jones Indices, S&P 500 factsheet as of July 31, 2026: https://topforeignstocks.com/wp-content/uploads/2026/08/SP500-Factsheet-as-of-Juy-31-2026.pdf
S&P Dow Jones Indices, S&P U.S. Indices Methodology (July 2026): https://www.spglobal.com/spdji/en/documents/methodologies/methodology-sp-us-indices.pdf
S&P Dow Jones Indices, "Update to S&P Composite 1500 Market Cap Guidelines" (2025): https://press.spglobal.com/2025-07-01-S-P-Dow-Jones-Indices-Announces-Update-to-S-P-Composite-1500-Market-Cap-Guidelines
The Register, "Nvidia joins S&P 500" (2001): https://www.theregister.com/on-prem/2001/11/30/nvidia-joins-sp-500/601641
CNN, Lou Dobbs Moneyline transcript, November 29, 2001: https://www.cnn.com/TRANSCRIPTS/0111/29/lt.22.html
National Mortgage News, "Lehman Removed From Stock Indices" (2008): https://www.nationalmortgagenews.com/news/lehman-removed-from-stock-indices
S&P Dow Jones Indices, "Insulet Set to Join S&P 500" (2023): https://press.spglobal.com/2023-03-10-Insulet-Set-to-Join-S-P-500
Federal Reserve Bank of Atlanta, Notes from the Vault (2009): https://www.atlantafed.org/cenfis/publications/notesfromthevault/0909
Reuters via Business Standard, "Key dates and milestones in the S&P 500's history": https://www.business-standard.com/amp/article/reuters/key-dates-and-milestones-in-the-s-p-500-s-history-113041000641_1.html
S&P 500 bear market statistics compiled from S&P 500 closing prices (2026): https://walnutinvest.com/stats/bear-market-statistics
DQYDJ, S&P 500 drawdown history since 1871: https://dqydj.com/sp-500-drawdown-history/
Wikipedia, "Closing milestones of the S&P 500": https://en.wikipedia.org/wiki/Closing_milestones_of_the_S%26P_500
TS2, "S&P 500 sets record" (October 2026): https://ts2.tech/en/sp-500-sets-record-but-fades-26-points-before-fed-minutes/
Mark Hulbert, "25 Years to Bounce Back? Try 4 1/2" (2009): https://www.historynewsnetwork.org/article/79770
UBS Global Investment Returns Yearbook 2024, Summary Edition: https://ubs.com/content/dam/assets/ib/global/in-focus/doc/ubs-global-investment-returns-yearbook-2024-summary-edition.pdf
NBER Digest, "A Century of Global Stock Markets" (Jorion and Goetzmann): https://www.nber.org/digest/jul97/century-global-stock-markets
SEC, Investor Bulletin on market-wide circuit breakers (2013): https://www.sec.gov/investor/alerts/circuitbreakersbulletin.htm
Mail & Guardian, "Zimbabwe's currency crashes, prices rocket" (2008): https://mg.co.za/article/2008-06-05-zimbabwes-currency-crashes-prices-rocket/
First Trust, "S&P 500 Index International Revenue by Sector" (2026): https://www.ftportfolios.com/Commentary/MarketCommentary/2026/9/24/sp-500-index-international-revenue-by-sector
S&P Dow Jones Indices, dividend report for Q4 2025 (2026): https://press.spglobal.com/2026-01-07-S-P-Dow-Jones-Indices-Reports-U-S-Common-Indicated-Dividend-Payments-Increase-of-13-1-Billion-in-Q4-2025-and-46-4-Billion-for-2025
J.P. Morgan Private Bank, "The Agony and the Ecstasy" (2014): https://www.chase.com/content/dam/privatebanking/en/mobile/documents/eotm/eotm_2014_09_02_agonyescstasy.pdf
Arizona State University W. P. Carey School, "Do stocks outperform Treasury bills?" (2018): https://news.wpcarey.asu.edu/20180917-do-stocks-outperform-treasury-bills
Marketplace, "Dow falling or not?" (2010): https://www.marketplace.org/story/2010/07/09/dow-falling-or-not
Crossing Wall Street, "Prechter Calls for Dow 1,000" (2010): https://www.crossingwallstreet.com/?p=5230
CNN Money, "Stocks end at new 2010 lows" (2010): https://money.cnn.com/2010/07/02/markets/markets_newyork/index.htm
SEC, Investor Bulletin: Understanding Margin Accounts: https://www.investor.gov/news-alerts/investor-bulletins/investor-bulletin-understanding-margin-accounts
The Daily Upside, "Archegos' Hwang Sentenced to 18 Years" (2024): https://www.thedailyupside.com/finance/hedge-funds/archegos-hwang-sentenced-to-18-years-for-gargantuan-fraud-that-walloped-wall-street/
SEC and FINRA, "Updated Investor Bulletin: Leveraged and Inverse ETFs" (2023): https://www.investor.gov/news-alerts/investor-alerts/sec-finra-investor-alert-leveraged-inverse-etfs
ETF.com, "Inverse VIX ETN Shuts Down" (2018): https://www.etf.com/sections/news/inverse-vix-etn-shuts-down
Quartz, "Japan's Nikkei stock index breaks its 1989 record" (2024): https://qz.com/japans-nikkei-stock-index-breaks-its-1989-record-and-su-1851277381
Wikipedia, "Nikkei 225": https://en.wikipedia.org/wiki/Nikkei_225



Comments