Why Smart, Hard-Working People Sell at the Very Bottom, and the One Simple Rule That Stops You Doing It Again


Investors sell at the bottom because the bottom is where the pain is greatest, not where the danger is. By the time prices hit their lowest point, the losses are biggest, the headlines are darkest, and weeks of red mornings have worn down even the most disciplined mind. Selling at that moment isn't a forecast. It's a way to make the pain stop.
And here is the part that surprises people: smart, hard-working, responsible people are more likely to do it, not less.
In this article, I'll show you why it happens, what it really costs in dollars, and the one simple rule that stops you ever doing it again.
The short answer ✔ The bottom is where fear peaks. Losses are largest, news is worst, and the daily drip of red has drained your patience. ✔ Losses hurt roughly twice as much as equal gains feel good, so selling feels like relief, not a mistake. ✔ Smart people aren't immune. An MIT study found investors over 45, married, with dependents, or who rate their own investing knowledge as good or excellent panic-sell more often. ✔ The real damage comes after. Almost a third of panic sellers never go back into stocks, and many who do return buy back at higher prices. ✔ The fix is one rule: only sell for a reason you wrote down before the fall. |
The night your thumb hits Sell
Picture a Monday in March 2020. You have worked hard for 25 years. You run a business or a department, you have raised a family, and you have saved like a responsible adult should.
In just over a month, the S&P 500 has fallen about 34%. A third of your retirement money has disappeared since mid-February. Every news channel shows empty streets, and your brother-in-law keeps messaging that he "got out in time".
At 11 p.m. you open your brokerage app. Your thumb hovers over Sell. You press it.
For the first time in weeks, you sleep.
That Monday was 23 March 2020, the exact bottom of the fastest bear market on record. The S&P 500 closed that day at 2,237. Five months later, on 18 August 2020, it closed at a new all-time high of 3,389.78. It had climbed more than 50% from the low.
If you sold that night, you did not avoid the crash. You had already taken the full crash. What you avoided was the recovery.
You are not stupid. You did what millions of intelligent people do, in every crash, in every country. So let's understand the machinery, because once you can see it, you can switch it off.
Why do investors sell at the bottom? Because that's where the pain peaks
Here is the uncomfortable truth. The selling isn't spread evenly through a crash. It piles up near the lowest prices.
Look at what happened in March 2020:
In Europe, Morningstar found that most of the month's record equity fund outflows came in the two weeks ending 13 and 20 March, right as stocks were reaching their low.
In the United States, Refinitiv Lipper reported that in the week to 18 March, investors poured a record $148 billion into money market funds, the biggest weekly inflow in its data going back to 1992.
In the United Kingdom, the Investment Association recorded a record £10 billion of net retail outflows from funds in March 2020.
Money ran to "safety" at the very moment stocks were cheapest.
It happens in good years too. DALBAR's long-running investor behaviour study found that in 2024, the average equity fund investor earned 16.54% while the S&P 500 returned 25.02%. Investors pulled money out of equity funds in every quarter of that year, and the biggest withdrawals came just before a major surge.
Why does selling cluster at the bottom? Because a market bottom isn't a single bad day. It's the end of a long string of bad days.
On day one of a fall, you shrug. On day ten, you're tense. By the second month, every morning has started with red numbers, every headline has been worse than the one before, and every friend has a story about someone who lost everything. Your patience is a fuel tank, and the bottom is where it runs dry.
So the pain is highest exactly when the price is lowest. That's not a coincidence. It's the same event seen from two sides.
Remember this A market bottom is the point of maximum pain, which is why it is also the point of maximum selling. If you ever feel a desperate urge to sell everything, that feeling itself is a clue you may be near the bottom, not the start of a crash. |
Why smart, hard-working people are more likely to sell at the bottom
You might think panic selling is something only beginners do. The data says otherwise.
In 2021, a team of MIT researchers including Professor Andrew Lo studied anonymised brokerage accounts from 2003 to 2015. They called a sudden, large sale of risky assets after a sharp drop "freaking out", and they built machine-learning models to predict who would do it.
Here is who freaked out most often:
Investors above the age of 45
Men (slightly more often than women)
People who were married or had more dependents
People who described their own investment experience or knowledge as good or excellent
The self-employed and business owners
Read that list again. It is a description of responsible, successful, hard-working adults.
Meanwhile, investors who said they had no investment experience were less likely to panic sell.
How can that be? When you know your situation, it makes sense.
You are trained to solve problems with action
A business owner who sees sales falling doesn't sit still. A manager whose project is going wrong steps in. Your whole career has rewarded you for spotting trouble early and acting decisively.
In investing, that instinct backfires. A diversified index fund that falls 30% is not a business that needs fixing. It's weather. "Doing something" feels responsible, but in a crash the most valuable thing you can do is nothing.
You are carrying other people's futures
If you have a spouse, children or parents who rely on you, a falling portfolio doesn't feel like a number. It feels like your family's security draining away. That raises the emotional stakes far above the money itself.
Confidence turns into a trap
If you believe you understand markets, you are more likely to believe you can step out now and step back in later at a better price. The MIT researchers found the panic sellers who reinvested often waited too long, and the median investor earned a zero to negative return after freaking out.
They also found that almost a third of panic sellers (30.9%) never went back into risky assets during the study period at all.
That's the real cost of selling at the bottom. It's not one bad trade. For many people, it's the end of their investing life.
If this is sounding familiar, you'll find more of these patterns in my guide to why smart people lose money in the stock market.
The 6 forces that push your thumb to the Sell button
Panic selling feels like a single decision. In reality, six forces stack on top of each other until the pressure becomes unbearable.

Force No. 1: Losses hurt about twice as much as gains feel good
In 1992, psychologists Amos Tversky and Daniel Kahneman estimated that a loss carries roughly 2.25 times the emotional weight of an equal gain. A 2024 review of 607 estimates, published in the Journal of Economic Literature, put the average closer to 2.
Either way, the message is the same. Losing $50,000 hurts far more than gaining $50,000 pleases you. So when your account is falling, every day feels like twice the pain your logic says it should.
Force No. 2: You look too often
In a famous 1997 experiment, Richard Thaler, Amos Tversky, Daniel Kahneman and Alan Schwartz gave people the same investment choices but changed how often they saw their results.
The group who got the most frequent feedback took the least risk and earned the least money.
More information made them poorer. Every look at a falling account is another dose of loss pain, and a phone app lets you take that dose fifty times a day.
Force No. 3: The pain piles up
One red day is easy to ignore. Thirty red days are not. Each new drop doesn't feel like a new event. It feels like confirmation that "this is never going to stop". By the bottom, you're not reacting to that day's move. You are reacting to the whole exhausting month.
Force No. 4: The story always sounds different this time
Every crash comes with a convincing reason why this one is permanent. In 2008, it was the banking system collapsing. In 2020, it was a pandemic shutting down the world. In April 2025, it was a trade war.
The story is always scary, always new and always told with total confidence. That's what makes it so persuasive. The S&P 500 has never had a 20-year period where it lost money, as I show in has the S&P 500 ever lost money over 20 years, but the story in your head never mentions that.
Force No. 5: Everyone around you is selling
When friends, colleagues and the TV are all selling, holding feels reckless. Your brain treats the crowd as information. In a crash, though, the crowd is mostly just scared people reacting to other scared people.
Force No. 6: The "I'll get back in when it's safe" promise
This is the most dangerous force, because it makes selling feel smart rather than scared. You tell yourself you're not giving up. You're just stepping aside until things calm down.
But "safe" never rings a bell. By the time the news feels safe, prices have already recovered. You have to be right twice: once when you sell, and again when you buy back. Almost nobody is.
The panic loop in one line Prices fall → you check more often → each loss hurts double → the scary story grows → everyone sells → you sell "until it's safe" → prices recover without you → you buy back higher, or never. |
What selling at the bottom really costs you
Let's turn the psychology into dollars, because this is where it stops being theory.
The gap between your fund's return and yours
Every year, Morningstar compares the return a fund earns with the return its investors actually get, after their buying and selling. The difference is called the investor return gap.
In its Mind the Gap study covering the 10 years to the end of 2025, the average dollar in US funds and ETFs earned 8.7% a year, while the funds themselves returned 9.9% a year. Investors lost 1.2 percentage points a year purely through the timing of their own decisions.
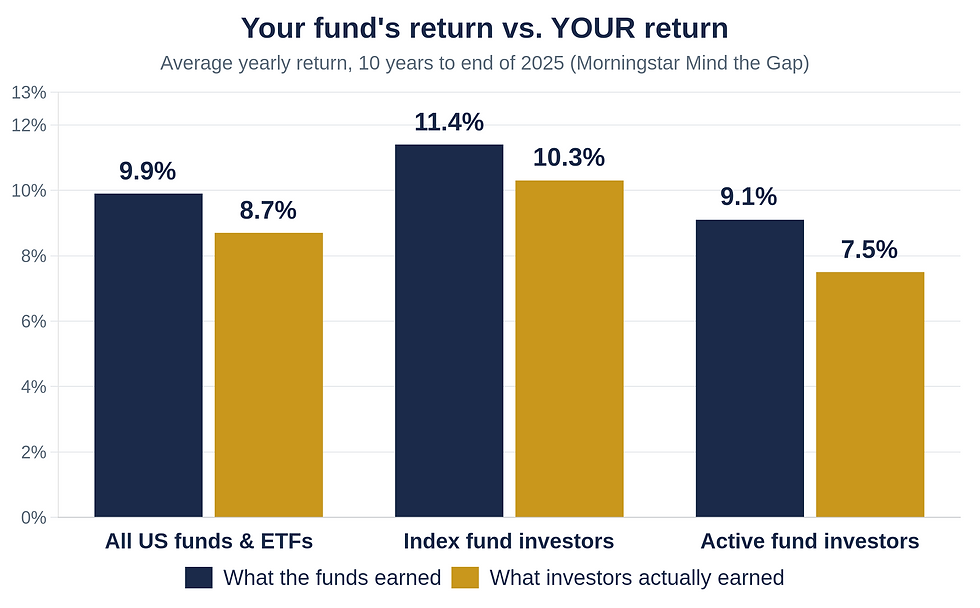
Even index fund investors, the people using the "right" product, earned 10.3% a year, 1.1 points less than their funds. Investors in active funds did worse, earning 7.5% with a 1.6-point gap.
Morningstar also found that investors in calmer funds kept nearly all of their gains, while those in choppier funds gave much more of theirs back. The more a fund swings, the more people are tempted to jump out at the wrong time.
A gap of 1.2 points sounds small. It isn't. Left to grow for 30 years, $100,000 earning 9.9% a year becomes about $1.7 million. At 8.7% a year, it becomes about $1.2 million. That's roughly half a million dollars lost to timing alone.
Worked example: $200,000 in the 2020 crash
Let's make it personal. Imagine you had $200,000 in an S&P 500 index fund at the market's peak on 19 February 2020. (To keep it simple, I'm using index prices only and ignoring dividends.)
Date | S&P 500 close | You stayed invested | You sold at the bottom |
19 Feb 2020 (peak) | 3,386.15 | $200,000 | $200,000 |
23 Mar 2020 (bottom) | 2,237.40 | $132,150 | $132,150 (sold) |
30 Jun 2020 | 3,100.29 | $183,116 | $132,150 in cash |
18 Aug 2020 (new record) | 3,389.78 | $200,214 | $132,150 in cash |

The investor who did nothing was back above $200,000 in six months.
The investor who sold at the bottom locked in a $67,850 loss. If they finally felt "safe" enough to buy back in August, they bought back at a record high with $132,150. They were now $68,064 behind their neighbour who did nothing, and that gap never closes on its own. Every future gain is now calculated on the smaller number.
Worked example: the same $200,000 in 2008
The 2020 crash was short. Here is a longer, harder one.
On 9 October 2007, the S&P 500 closed at a record 1,565.15. By 9 March 2009, it had fallen about 57% to 676.53. It didn't reach a new record until 28 March 2013, more than five years after the peak.
Moment | You stayed invested | You sold at the bottom |
Peak, 9 Oct 2007 | $200,000 | $200,000 |
Bottom, 9 Mar 2009 | $86,449 | $86,449 (sold) |
New record, 28 Mar 2013 | $200,516 | $86,449 if you bought back that day |
That's a $114,067 difference created by one decision on one terrible day, and that's before counting four years of dividends the holder also received.
If you're staring at a 50% hole right now, my article on how long it takes to recover from a 50% stock market loss walks through the maths step by step.
What happened to real people who sold in 2008
Fidelity, one of the biggest retirement plan providers in the US, tracked its 401(k) savers through the 2008–2009 crash.
Savers who moved everything out of stocks between October 2008 and March 2009 and stayed out saw their account balances rise just 2% by mid-2011. Those who got out and later came back were up 25%. Those who simply stayed invested were up 50%.

Fidelity ran the numbers again years later. Over the 12 years to December 2021, accounts of savers who had gone completely to cash during the crisis grew 389%, mostly thanks to their ongoing contributions. Accounts of savers who stayed invested grew 650%.
Same people, same plans, same crash. The only difference was one decision.
Why missing a handful of days is so expensive
Here is the cruel twist. The market's best days don't arrive when things feel good. They arrive right in the middle of the panic.
J.P. Morgan Asset Management has found that most of the S&P 500's 10 best days over the past 20 years came within two weeks of one of its 10 worst days. When you sell during the fear, you are almost certain to miss the rebound days too.
Franklin Templeton calculated what happened to money invested in the S&P 500 over the 20 years from 2006 to 2025, depending on how many of the best days an investor missed.

Out of roughly 5,000 trading days, missing just the 10 best cut the ending value by more than half. Missing 40 meant losing money over two decades in one of the strongest markets in history.
You saw this live in April 2025. After a tariff shock pushed the S&P 500 nearly 19% below its record, the index jumped 9.5% in a single day on 9 April, one of its best days since World War II. Anyone who sold the day before missed it. By 27 June 2025, the S&P 500 was back at a record high.
The real lesson You can't get the best days without sitting through the worst ones. They arrive together, like thunder and rain. Selling to avoid the storm almost always means missing the sunshine that follows. |
The one simple rule that stops you doing it again
You can't remove the fear. You're human, and your brain was built to run from danger long before stock markets existed.
But you can remove the decision. That's what the rule does.
The Before Rule I will only sell an investment for a reason I wrote down before the market fell. A falling price is never one of those reasons. |
That's it. One sentence. Let me explain why it works so well.
It moves the decision to your calmest self
When the market is calm, you're rational. You can think clearly about what you need, when you need it, and how much risk you can live with. When the market is crashing, you're running on adrenaline.
The Before Rule lets your calm self make the decision in advance, and your panicked self simply follows the instructions. It's the same trick Ulysses used when he had his crew tie him to the mast so he could hear the Sirens without steering onto the rocks.
It turns "I should" into "If this, then that"
Psychologists call a pre-made "if this happens, then I will do that" plan an implementation intention. In a 2006 review of 94 studies, Peter Gollwitzer and Paschal Sheeran found these simple plans had a medium-to-large effect on whether people actually reached their goals.
A vague goal like "I'll stay calm next crash" collapses under pressure. A written rule like "If prices fall, I do not sell, because a falling price is not on my list" holds.
The world's best investors use written rules too
On 16 October 2008, in the middle of the financial crisis, Warren Buffett wrote an opinion piece in The New York Times titled "Buy American. I Am." He explained that a simple rule guided his buying: "Be fearful when others are greedy, and be greedy when others are fearful."
He was early. A month later, the market was about 20% lower. But his rule didn't depend on picking the bottom, and within around nine months the market was back above where it stood the day his article was printed.
Buffett didn't decide what to do on the worst day. He had decided long before. That is the whole point.

What CAN go on your list
These are legitimate reasons to sell, as long as you write them down in calm times:
A planned need for the money. You're buying a home next year, or paying a child's university fees in 18 months. (Money needed that soon shouldn't really be in stocks at all, but if it is, selling for this reason is fine.)
Rebalancing on your set date. If you hold, say, 70% stocks and 30% bonds, once a year you bring it back to 70/30. After a crash, this usually means buying stocks, not selling them.
Your life changed. A new retirement date, a health issue, a change in your family. Notice that these are changes in your life, not in the market.
The investment itself broke. The fees went up sharply, the fund stopped tracking its index, or the company running it is in genuine trouble. (Here is what happens to your money if an index fund provider goes bust.)
A clearly better version of the same thing. For example, swapping to a cheaper fund that tracks the same index, done on the same day.
What can NEVER go on your list
"The price fell."
"The news is terrible."
"Everyone else is selling."
"I'll buy back lower."
"I can't take this any more."
That last one deserves a word. If a fall genuinely leaves you unable to sleep, the answer isn't to sell in the storm. It's to write down a calmer mix for your future self, on a calm day, and move towards it then. My article on what to do when you can't sleep after a big stock loss covers that night itself.
How to set up the Before Rule tonight, in 20 minutes
A rule only works if it exists on paper before you need it. Here is how to build yours tonight.
Step 1: Write your Sell Permission Slip
Copy this into a notebook, a note on your phone, or print it and keep it with your account details.
My Sell Permission Slip Date written: ____________ I will only sell my investments for these reasons: ☐ Planned need: $________ on ________ (date) for ____________________ ☐ Rebalancing on ________ each year, back to ____% stocks / ____% bonds and cash ☐ My life changed: ____________________________________ ☐ The investment itself broke (fees, tracking, provider problems) ☐ Switching to a cheaper fund that tracks the same index, on the same day A falling price is NOT on this list. Neither is the news. If I still want to sell for any other reason, I will wait 30 days and re-read this slip first. Signed: ____________ Witness (spouse or friend): ____________ |
Step 2: Remove the reasons you might be forced to sell
Many people who sell at the bottom don't choose to. A job loss, a medical bill or a business cash crunch forces them.
So keep an emergency fund in cash, outside the market. Many planners suggest three to six months of living costs. Then keep any money you'll need within the next few years in cash or short-term bonds rather than stocks. When the crash comes, you'll have something to live on that isn't falling.
Step 3: Choose your mix and your rebalancing date
Decide how much you'll hold in stocks and how much in safer assets. Then pick one date a year to rebalance, such as your birthday or the first working day of January.
Keep it simple. You don't need ten funds. One or two broad index funds is enough for most people, as I explain in how many index funds should you own.
Step 4: Add a 30-day cooling-off period
If you ever want to sell for a reason that isn't on your slip, you must wait 30 days. Write it on the slip itself.
In 2020, the S&P 500 had already climbed more than 30% from its low within about seven weeks. A 30-day wait gives the panic time to burn out and the facts time to catch up.
Step 5: Look less often
Remember the 1997 experiment: more feedback, more fear, less money.
Move your brokerage app off your home screen, or delete it and log in on a computer. Turn off price alerts. Check your account once a quarter, or on your rebalancing date. Your money will grow just as fast when you aren't watching it.
Step 6: Get a co-signer
Give a copy of your slip to your spouse or a trusted friend. Agree that you won't sell anything outside the slip without talking to them first.
Having to say "I want to sell because the news scared me" out loud to another person is often enough to stop you. If money has already caused tension at home, here's how to talk to your spouse about investment losses.
Step 7: Automate your buying
Set up a fixed monthly investment into your index fund. In a crash, that automatic purchase quietly buys more units at lower prices while your emotions are busy panicking. Fidelity found that 401(k) savers who kept contributing through the 2008–2009 crash saw their balances rise 64% by mid-2011, against 26% for those who stopped.
Your 20-minute checklist ☐ Sell Permission Slip written and signed ☐ Emergency fund in cash, outside the market ☐ Money needed in the next few years out of stocks ☐ Stock/bond mix chosen and rebalancing date set ☐ 30-day cooling-off line added to the slip ☐ Brokerage app moved off the home screen, price alerts off ☐ Co-signer has a copy ☐ Monthly automatic investment switched on |
What to tell yourself on the worst day
Even with a rule, the worst day will feel awful. That's normal. The goal isn't to feel brave. It's to follow the slip.
When the red numbers come, read these lines slowly:
"I've already been through the fall. Selling now only guarantees I miss the recovery."
"This feeling is the bottom talking. Maximum fear is where the selling peaks."
"Is this reason on my slip? No? Then the answer is no."
"My worst-case plan is already in place. My emergency fund and near-term money are not in stocks."
"The best days usually arrive within two weeks of the worst. I want to be here for them."
Then close the app and go for a walk. For a fuller game plan when markets drop sharply, read what calm investors do after a 20% drop.
Already sold at the bottom? How to come back without making it worse
If you've already sold at the bottom, you're in very large company. Don't let the regret become a second mistake.
Forgive yourself, then focus on the next 20 years
The money you lost is gone whether you dwell on it or not. What matters now is not missing the next decade of growth. Remember the MIT finding: almost a third of panic sellers never went back. Don't let one bad night decide the rest of your financial life.
Don't wait for "all clear"
There is no all-clear signal. Waiting for the market to "settle" usually means buying back higher, after the news finally feels good. Pick a plan today instead.
Choose how to go back in
You have two sensible options. Invest the whole amount at once, which has historically tended to come out ahead more often, or invest it in equal monthly amounts over 6 to 12 months, which is easier on your nerves. I compare both in lump sum or monthly after a big loss.
If you're still holding something that has fallen and you're torn about it, my guide on whether to sell at a loss or wait to break even will help you decide calmly.
Write the Before Rule before you go back in
Don't put a single dollar back into the market until your Sell Permission Slip is written and signed. That's how you make sure this was the last time.
Frequently asked questions
Why do investors sell at the bottom?
Because the bottom is where the pain is greatest. Losses are largest, news is worst, and weeks of daily drops have exhausted investors. Losses feel about twice as painful as equal gains, so selling brings relief. That's why selling tends to cluster near the lowest prices rather than spreading evenly through a crash.
Is it ever right to sell during a crash?
Yes, if the reason was planned before the crash: money you need for a dated expense, rebalancing on your set date, a real change in your life, or a problem with the investment itself. A falling price alone is not a good reason. It usually just locks in the loss.
How do I stop panic selling?
Write down, in calm times, the only reasons you'll sell, and leave "the price fell" off the list. Keep an emergency fund outside the market, check your account less often, add a 30-day cooling-off period, and automate monthly investing so your plan runs without your emotions.
What percentage of investors panic sell?
An MIT study of US brokerage accounts from 2003 to 2015 found only about 0.1% of investors panic sell at any given moment, but that rises to up to three times the normal rate during large market moves. Almost a third of those panic sellers never went back into risky assets.
Should I sell now and buy back when the market recovers?
That plan requires you to be right twice, about when to get out and when to get back in. Most people get back in only after prices have recovered. Fidelity found 401(k) savers who went to cash in 2008–2009 and later came back were up 25% by 2011, versus 50% for those who stayed.
How long does the stock market take to recover after a crash?
It varies widely. After the 2020 crash, the S&P 500 hit a new record about five months after its low. After the 2007–2009 crash, it took until March 2013, about four years after the low. Including dividends, recoveries are usually somewhat faster than price charts suggest.
Does checking my portfolio less often really help?
Yes. In a 1997 experiment by Thaler, Tversky, Kahneman and Schwartz, the people given the most frequent feedback on their investments took the least risk and earned the least money. Checking quarterly instead of daily means you see far fewer losses, so you feel far less fear.
You were never the problem. The missing rule was
Smart, hard-working people sell at the bottom because they care, because they're used to taking action, and because the market saves its worst pain for the moment just before it turns.
You can't change the market's moods. But tonight, in 20 minutes, you can write the one rule that means your calm self makes your decisions, not your frightened self.
The next crash will come. When it does, you won't be the one pressing Sell at 11 p.m. You'll be the one quietly following your slip, while the market does the rest.
Free report: why you lost money (and why it wasn't your fault) If you've lost money in the stock market and want to understand exactly what went wrong, and the simple index fund approach that fixes it, download my free 38-page report. |
About the author
Stephen Loke has been a student of the market for more than 15 years. He is also an agritourism entrepreneur whose farm has been featured in Bloomberg News and Asahi Shimbun.
This article is general education, not personal financial advice. I'm not a licensed financial adviser. Past performance doesn't guarantee future results. Please consider your own situation, or speak to a licensed adviser, before making investment decisions.
Sources
ThinkAdvisor: Don't panic over panic selling, MIT researchers (2021)
International Adviser: Men and over 45s most likely to panic sell investments
Advisor Perspectives: Mind the Gap, ETF investors missed $3.8 trillion (2026)
Morningstar: Direct Asset Flows Commentary, Europe, March 2020
Refinitiv Lipper: Weekly FundFlows Insight Report, week ended 18 March 2020
Investment Association: Funds hit by £10bn outflows in March when lockdowns began
ETF Trends: S&P 500 drawdowns, 2007 peak, 2009 low and 2013 record
J.P. Morgan Asset Management: 2025 Guide to Retirement press release
WTTW / Associated Press: S&P 500 soars 9.5% after tariff pause (9 Apr 2025)
Gollwitzer & Sheeran: Implementation intentions and goal achievement, a meta-analysis (2006)
Warren Buffett: Buy American. I Am. (The New York Times, 16 Oct 2008)
Motley Fool via Webull: Warren Buffett wrote "Buy American. I Am." 18 years ago this week




Comments